Concept
Trailing Method Taxonomy
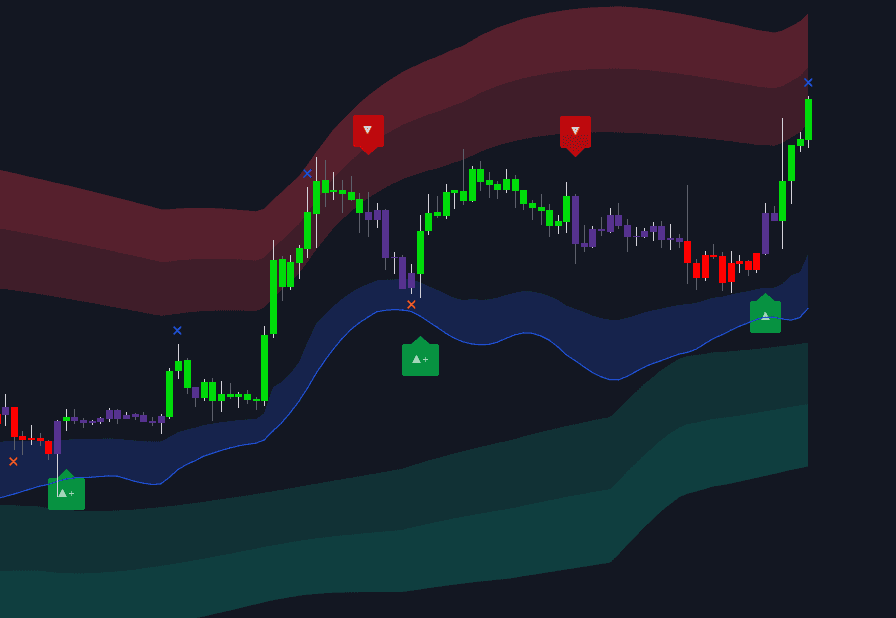
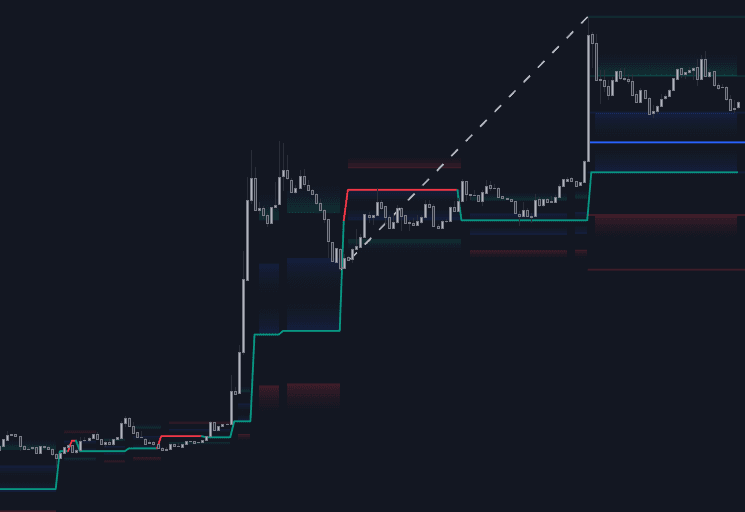
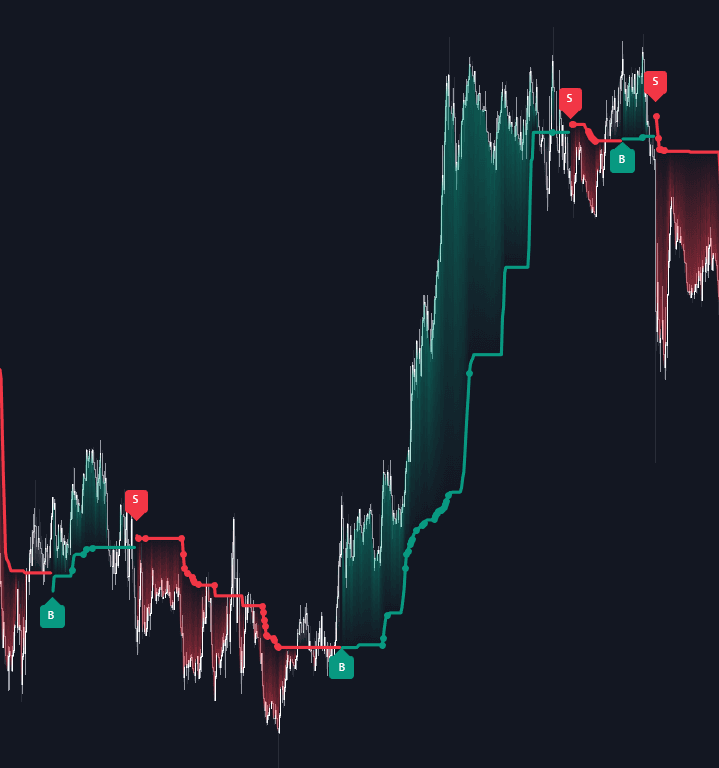
Trailing Method Taxonomy, also known as swing-trail, MA trail, ATR/chandelier, PSAR, is a Risk, Sizing & Exits concept. The Library holds 11 implementations, each one a working definition you can pull into Quant.
Top Trailing Method Taxonomy indicators
The top custom implementations, built on the original standard Trailing Method Taxonomy formula.
11 total
Any of the 11 Trailing Method Taxonomy implementations below can become a backtested trading strategy — describe your rules and Quant writes the code.
What is a Trailing Method Taxonomy?
A trailing method taxonomy classifies trailing stops by what the stop follows and how it is allowed to move. Every trailing exit answers three design questions: what anchor the level tracks (a confirmed swing high or low, a moving average, a volatility offset, a channel extreme, or a fixed percentage), when it updates (every bar, or only when price makes a new extreme), and whether it can ever loosen or only ratchet tighter. Sorting the dozens of published methods along those axes collapses them into a handful of families.
The families: structure stops trail behind confirmed swings; moving-average trails exit on a cross of the average or use the line itself as the stop; volatility trails offset price by a multiple of average true range, as in the volatility stop and the chandelier; channel trails exit at the N-bar extreme, Donchian style; parametric curves such as Parabolic SAR tighten automatically as the trade ages; percent trails keep a fixed fractional distance from the peak; and profit-lock ratchets jump the stop to breakeven and beyond at preset milestones.
The taxonomy matters because the family choice, more than the exact parameter, sets the trade-off every trailing exit makes: giveback versus whipsaw. Tight, fast-updating trails protect open profit but get shaken out by ordinary pullbacks; wide, slow ones survive the pullbacks and hand back more at the end. No family wins in every regime, so the practical use of the taxonomy is matching a trail's behavior to how the traded market actually moves, then testing that choice rather than assuming it.
How to classify a trailing method
Any trailing stop you meet, whatever its trade name, can be placed in the taxonomy by answering four questions.
- 1Name the anchor. What does the level follow: a structure point (the last confirmed swing), a moving average, a volatility offset (k × ATR from the close or the trade's best price), a channel extreme (the lowest low or highest high of the last N bars), or a fixed percent from the peak?
- 2Name the update rule. Does the level recalculate every bar or only when a new extreme prints, and does it trigger on a close beyond the line or on any intrabar touch?
- 3Name the tightening profile. Constant distance (chandelier-style), accelerating (Parabolic SAR increases its step each time price makes a new extreme), or stepped (profit-lock ratchets that move only at milestones).
- 4Name the exit behavior. Exit-only, or stop-and-reverse, where crossing the line closes the trade and opens the opposite one.
How it's calculated
Each trailing method produces a candidate stop every bar, and a ratchet keeps the stop moving only in the trade's favor.
Canonical settings: the chandelier exit is HH over 22 bars with k = 3 (Chuck LeBeau); the Donchian exit uses the 10- or 20-bar low (Turtle rules); the SAR recursion is Wilder's, omitting its reversal and clamping rules.
Volatility-adaptive trails recompute k × ATR_t each bar so the stop distance breathes with volatility, while the SAR tightens parabolically as AF grows.
Whether an exit fires on an intrabar touch or only on a bar close is an implementation choice that changes results.
How traders use it
- As shared vocabulary for comparing exits: describing a method as an N-bar channel trail or a 3 × ATR chandelier states its anchor, update rule, and tightening profile precisely, which makes backtests comparable across systems.
- As a regime-matching guide: volatility trails adapt their distance to current conditions, structure trails respect the levels trends typically retrace to, and channel trails are slow but hard to shake; which behavior helps depends on whether the market trends cleanly or chops.
- In layered exits: many systems run a wide disaster stop from one family alongside a tighter profit-lock ratchet from another and honor whichever line is closer at any moment.
- As the alternative to fixed targets: trend-following systems usually trail because a preset target caps the right tail of outcomes, while mean-reversion trades usually prefer a profit target because the expected move is bounded.
Trailing Method Taxonomy vs related concepts
Volatility Stop: One member family, not a rival: the k × ATR trails. The taxonomy is the map, and the volatility stop is one of its most heavily implemented regions.
Parabolic SAR: Also a member: a parametric trail whose distance tightens by an acceleration factor as new extremes print, rather than tracking structure, an average, or an ATR multiple.
Profit Target Taxonomy: The other half of exit design. Targets predefine a level to exit into strength; trailing methods follow from behind and exit only after price has already turned.
Stop-and-reverse: An exit behavior, not a trailing family: almost any trail can be run stop-and-reverse, flipping the position on a cross instead of going flat.
More Trailing Method Taxonomy implementations
Concept family
Risk, Sizing & Exits
37 concepts mapped · 37 in the Library
Trailing Method Taxonomy FAQ
Turn Trailing Method Taxonomy into a trading strategy.
Take any implementation from this page into Quant, then build on it, backtest it on real data, and keep refining it in conversation.