All indicators

Market Sentiment Technicals

By LuxAlgoJun 11, 2024

Static chart image
Price Action BasedDashboardMoving Averages

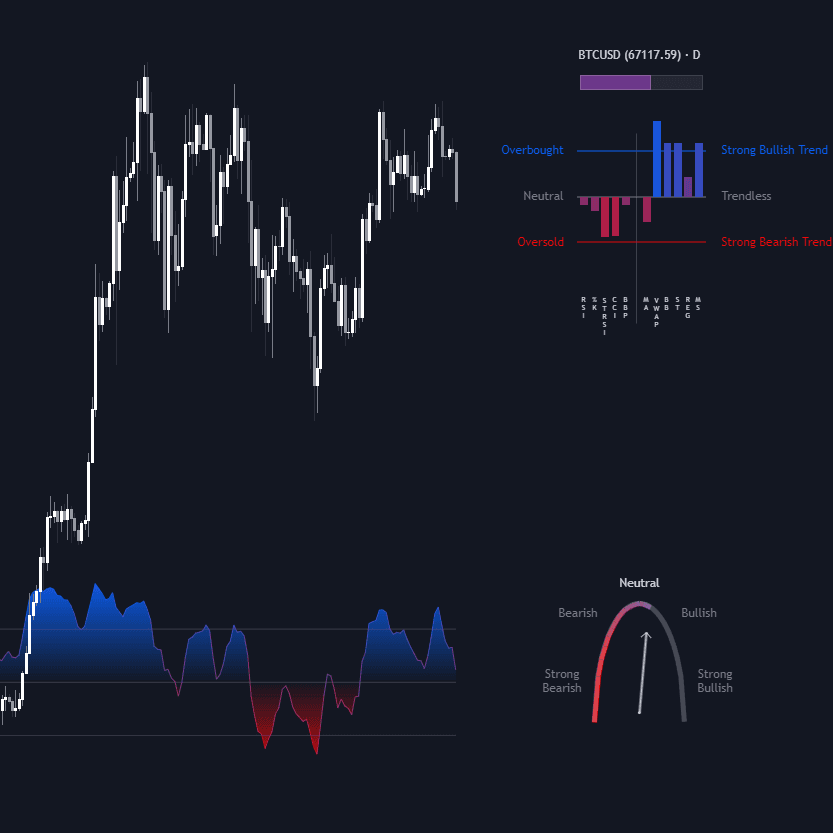
The Market Sentiment Technicals indicator is a comprehensive tool designed to provide traders with quick and easy insights into market sentiment by leveraging a range of technical analysis techniques. It synthesizes the evaluated outputs from diverse techniques such as price action market structures, trend indicators, volatility indicators, and momentum oscillators into a singular value. This consolidated data is then presented through an oscillator format, technical rating, and a histogram panel to illustrate the sentiment of each component alongside the overall sentiment.

How to Trade the Market Sentiment Technicals Indicator?

indicator image

The Market Sentiment Technicals indicator serves as an essential tool for traders looking to gauge market sentiment effortlessly. By combining the sentiments of multiple technical analysis techniques into one coherent value, the indicator allows users to discern whether the market is trending upwards, moving sideways, or trending downwards. Traders can utilize this tool to make more informed trading decisions based on the aggregated sentiment.

Decoding the Indicators Sentiment Panel

The indicators sentiment panel displays normalized sentiment scores for each supported indicator and offers a synthesized representation derived by averaging all individual sentiments. This makes it easier for traders to perceive the collective sentiment at a glance.

indicator image

Understanding the Market Sentiment Meter

This component derives from the averaged representation of individual sentiments to deliver a quick assessment of the overall market sentiment, effectively guiding users in their trading strategies.

indicator image

Market Sentiment Oscillator Insights

The market sentiment oscillator visually showcases both current and historical market strengths, helping traders identify trend directions, momentum, and overbought or oversold conditions. This is crucial for anticipating potential trend reversals and making timely decisions.

indicator image

Detecting divergence, which occurs when the price action does not align with the oscillator's indications, provides valuable insights into possible changes in price trends.

indicator image

Delving into Market Sentiment Technicals

The Market Sentiment Technicals indicator integrates multiple technical analysis techniques to offer intricate market data interpretations. Each set of indicators offers unique insights into different market behavior aspects.

Diving Deep into Momentum Indicators

Momentum indicators shine a light on the speed and shifts in price movements, often signaling whether a trend is gaining or losing strength.

  • Relative Strength Index (RSI): Assesses price change magnitudes to detect overbought or oversold scenarios.
  • Stochastic %K: Compares closing prices with a specified period's range to find possible reversal points.
  • Stochastic RSI Fast: Blends the features of Stochastic oscillators and RSI for efficient momentum and level evaluations.
  • Commodity Channel Index (CCI): Evaluates how much an asset's price deviates from its statistical average, establishing trend strength and conditions.
  • Bull Bear Power: Analyzes the buying and selling pressures in the market.

Identifying Trends with Trend Indicators

These indicators help traders spot the market trends and establish their trajectory.

  • Moving Averages: Offers a smooth depiction of underlying price data for trend analysis.
  • Bollinger Bands: Consists of bands that outline market volatility and a middle band showing the average.
  • Supertrend: A trailing stop mechanism for current trend direction identification.
  • Linear Regression: Fits prior data points to forecast upcoming price movements and trends.

Unpacking Market Structures

  • Market Structures: Evaluates price movement patterns, including Break of Structure (BOS) and Market Structure Shifts (MSS) or Change of Character (CHoCH), to pinpoint potential market turning or continuation points.

Decoding the Normalization Technique

The normalization technique uses buy-sell signals to assess trend indicators. Price movements are tracked and normalized using these signals.

normalize(buy, sell, smooth)=>
    var os = 0
    var float max = na
    var float min = na
    os := buy ? 1 : sell ? -1 : os
    
    max := os > os[1] ? close : os < os[1] ? max : math.max(close, max)
    min := os < os[1] ? close : os > os[1] ? min : math.min(close, min)

    ta.sma((close - min)/(max - min), smooth) * 100

In the provided Pine Script snippet:

  • The os variable monitors market sentiment, using 1 for buy signals and -1 for sell signals, indicating bullishness and bearishness.
  • max and min help track extreme sentiments, adjusting as sentiment changes from buying to selling.

Normalization is achieved by comparing current prices to sentiment extremes. The result is initially smoothed with a 3-period simple moving average, which users can adjust through the script settings.

indicator image

Configuration Options

General Settings

  • Timeframe: Chooses the timeframe affecting sentiment calculation—lower selections revert to the chart's timeframe.
  • Horizontal Offset: Sets the display distance of indicator visual components from the main chart.
  • Gradient Colors: Customizable gradient color settings.

Customizing the Indicators Sentiment Panel

  • Indicators Sentiment Panel: Option to toggle panel visibility.
  • Panel Height: Sets panel height.

Fine-Tuning the Market Sentiment Meter

  • Market Sentiment Meter: Toggle the speedometer-like meter's visibility.

Market Sentiment Oscillator Adjustments

  • Market Sentiment Oscillator: Option to toggle the oscillator's visibility.
  • Show Divergence: Detect divergences based on selected options.
  • Oscillator Line Width: Customizes the line width.
  • Oscillator Height: Sets the oscillator's height.

Tailoring Individual Component Settings

Generally,

  • Source: Data source selection for computations.
  • Length: Specifies the calculation period.
  • Smoothing: Defines the smoothness degree of evaluated values.

Trend Indicators Normalization Configuration

  • Smoothing: Determines normalized value smoothing period for moving averages, Bollinger Bands, Supertrend, VWAP bands, and market structures.

Limitations of the Indicator

As with any technical analysis tool, the Market Sentiment Technicals indicator is not infallible. It relies heavily on historical data and patterns, which might not always predict future market conditions accurately. External factors like economic news, geopolitical events, and market psychology can greatly influence market sentiment beyond what technical analysis can capture.

FAQ

How can I access the Market Sentiment Technicals Indicator?

You can get access on the LuxAlgo Library for charting platforms like TradingView, MetaTrader (MT4/MT5), and NinjaTrader for free.

What is the Market Sentiment Meter designed to do?

The Market Sentiment Meter consolidates all individual sentiments and offers a quick insight into overall market sentiment, helping traders in their strategy formulation.

Free indicator

Get free access to this indicator on the platforms below.

TradingView
NinjaTrader
MetaTrader 4/5

Unlock the entire LuxAlgo Library

Every indicator, every strategy, full charts, and complete access to Quant — our AI agent.