


Trendlines with Breaks Oscillator
Nov 12, 2025
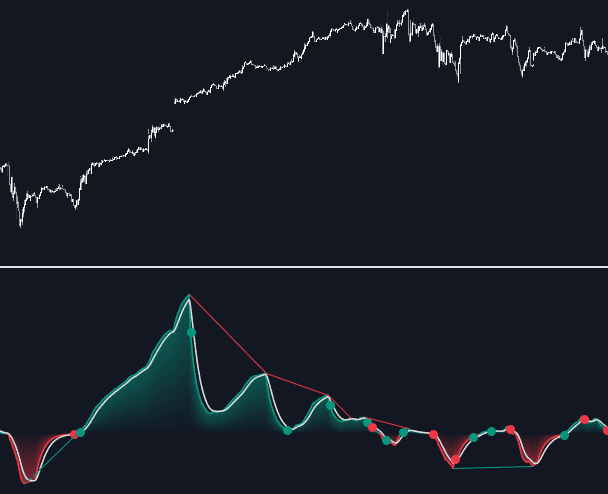
The Trendlines with Breaks Oscillator is a powerful trading indicator designed to measure momentum and trend direction by analyzing the distance between bullish and bearish trendline breakouts. Built upon the original Trendlines with Breaks indicator, this oscillator offers a visual and dynamic way to understand when momentum shifts occur, detect divergences, and spot potential trend reversals early.
Unlike conventional oscillators, this tool is rooted in price structure and breakout logic, making it ideal for traders who combine price action with technical indicators for deeper confirmation.
How to Trade with the Trendlines with Breaks Oscillator
This oscillator extends the capabilities of our Trendlines with Breaks indicator — which identifies and highlights bullish and bearish trendline breaks on the chart — by translating those breakouts into an easy-to-read momentum oscillator.
It tracks the maximum distance between price and the break of bullish and bearish trendlines, then calculates the delta between the two. When the oscillator is above zero, the market is showing bullish momentum; when it’s below zero, bearish momentum dominates.
- An ascending slope signals strengthening upward momentum.
- A descending slope shows weakening momentum or downward pressure.
Green and red dots appear on the oscillator to mark breakout events:
- Green dots = bullish breakouts from descending trendlines.
- Red dots = bearish breakouts from ascending trendlines.
The oscillator’s responsiveness is controlled by two settings: Short Alpha Length and Long Alpha Length. These parameters create synthetic EMAs that smooth bullish and bearish break distances differently. The difference between the two forms the oscillator value.
Larger alpha values create smoother, slower reactions — ideal for tracking major market trends — while smaller alphas make the oscillator more sensitive to short-term price movements.
The oscillator uses the same trendline detection logic as the base indicator, built from three main components:
- Swing length (the lookback for swing highs and lows)
- Slope steepness
- Slope calculation method
Adjusting these parameters allows traders to tailor the oscillator’s sensitivity to their trading style — from short-term breakouts to longer-term market trends.
Using the Signal Line for Trading Confirmation
The Signal Line smooths out oscillator fluctuations and helps confirm potential entry and exit signals.
When the oscillator crosses the signal line:
- Bullish crossovers (oscillator crossing above signal line) often precede upward corrections or rallies.
- Bearish crossovers (oscillator crossing below signal line) often precede downward corrections or pullbacks.
Traders can choose among 10 different smoothing methods and customize the smoothing length to adjust the balance between reactivity and stability.
Spotting Divergences for Early Reversals
The built-in divergence detector identifies momentum weakening or strengthening relative to price action — a powerful clue for potential reversals.
- Bearish divergence: price makes higher highs, but the oscillator forms lower highs.
- Bullish divergence: price makes lower lows, but the oscillator forms higher lows.
You can fine-tune the detection length to control how sensitive the divergence detector is. Shorter lengths pick up smaller divergences, while longer ones filter out noise and focus on major market turning points.
Settings Overview
Trendlines
- Swing Detection Lookback: Defines how far back to look for swing highs/lows when detecting trendlines.
- Slope: Adjusts steepness;
0for flat levels, values above1for steeper lines. - Slope Calculation Method: Selects the method used to determine trendline angles.
Oscillator
- Short Alpha Length: Defines the short-term synthetic EMA smoothing period.
- Long Alpha Length: Defines the long-term synthetic EMA smoothing period.
- Smoothing Signal: Choose the smoothing method and period for the signal line.
- Divergences: Toggle on/off and set the detection length.
Style
- Bullish: Customize the bullish color.
- Bearish: Customize the bearish color.
FAQ
What is the Trendlines with Breaks Oscillator used for?
It helps traders visualize momentum shifts and trend strength based on the distance between bullish and bearish trendline breaks — making it useful for spotting trend continuations or reversals.
How do I interpret the oscillator values?
Values above zero indicate bullish momentum; below zero indicate bearish. The slope direction also helps confirm momentum strength.
Does the oscillator repaint?
No, it updates in real-time using confirmed breakouts and historical price data from the Trendlines with Breaks algorithm.
How can I access the Trendlines with Breaks Oscillator?
You can get access on the LuxAlgo Library for charting platforms like TradingView, MetaTrader (MT4/MT5), and NinjaTrader for free.
Trading & investing are risky and many will lose money in connection with trading and investing activities. All content on this site is not intended to, and should not be, construed as financial advice. Decisions to buy, sell, hold or trade in securities, commodities and other investments involve risk and are best made based on the advice of qualified financial professionals. Past performance does not guarantee future results.
Hypothetical or Simulated performance results have certain limitations. Unlike an actual performance record, simulated results do not represent actual trading. Also, since the trades have not been executed, the results may have under-or-over compensated for the impact, if any, of certain market factors, including, but not limited to, lack of liquidity. Simulated trading programs in general are designed with the benefit of hindsight, and are based on historical information. No representation is being made that any account will or is likely to achieve profit or losses similar to those shown.
Testimonials appearing on this website may not be representative of other clients or customers and is not a guarantee of future performance or success.
As a provider of technical analysis tools and strategies, we do not have access to the personal trading accounts or brokerage statements of our customers. As a result, we have no reason to believe our customers perform better or worse than traders as a whole based on any content, tool, or platform feature we provide.
Charts used on this site are by TradingView in which the majority of our technical indicators are built on. TradingView® is a registered trademark of TradingView, Inc. www.TradingView.comTradingView® has no affiliation with the owner, developer, or provider of the Services described herein.
Market data is provided by CBOE, CME Group, BarChart, CoinAPI. CBOE BZX real-time US equities data is licensed from CBOE and provided through BarChart. Real-time futures data is licensed from CME Group and provided through BarChart. Select cryptocurrency data, including major coins, is provided through CoinAPI. All data is provided “as is” and should be verified independently for trading purposes.
This does not represent our full Disclaimer. Please read our full disclaimer.
© 2026 LuxAlgo Global, LLC.