Volumetric Toolkit
 By LuxAlgoSep 28, 2023
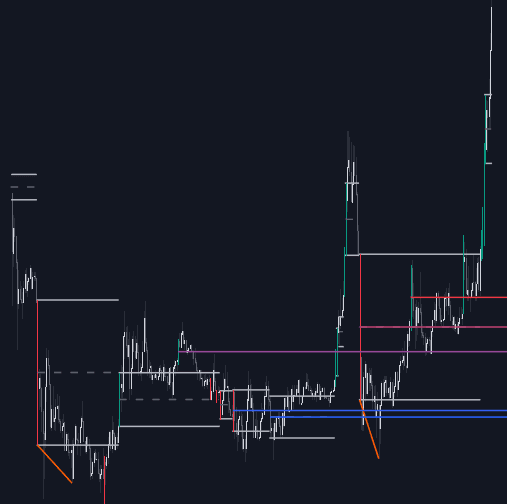
Volumetric Toolkit is a four-feature suite that reads price action through the volume behind it, from liquidity-built trading ranges to volume divergence detection. Everything rests on one premise: volume measures participants' interest in an asset, and that interest keeps shifting. Each feature isolates a different way unusual participation prints on the chart — and because volume data is required, symbols without it are not compatible.
How to Trade the Volumetric Toolkit?
- Ranges Of Interest: the high and low from a candle printed on a liquidity surge define a range whose extremities behave like support and resistance zones; a high-liquidity breakout from the range may signal continuation.
- Impulses: volume sets a new high while price prints a higher high (bullish, green) or lower low (bearish, red); an impulse against the prevailing trend can foreshadow reversal.
- Levels Of Interest: closing prices that coincided with volume peaks stay on the chart as classic support/resistance references.
- Volume Divergences: price presses to a fresh extreme while volume prints a lower high — participation is thinning and the trend may be tiring.
Levels Of Interest and Volume Divergences adjust retrospectively (backpainting), so they serve better as analytical context than as real-time triggers.
Volumetric Toolkit Settings
- Show Ranges Of Interest / Length: toggles the ranges; higher lengths demand more volume before a new range prints.
- Show Impulses / Length: toggles impulses; longer settings keep only significant ones, pointing at longer-term reversals.
- Show / Length (Levels Of Interest): how many recent levels display and how sensitive detection is to volume events.
- Show Divergences / Length: toggles divergences and sets the period for recognizing price tops, bottoms, and volume peaks.
Frequently Asked Questions
Do all four features work everywhere?
They work on any symbol with volume data, on any timeframe. Instruments without a volume feed give the toolkit nothing to measure, so nothing plots.
Why a toolkit instead of a single volume line?
A cumulative line like On Balance Volume compresses participation into one running series; the toolkit instead marks discrete, chart-located events — ranges, impulses, levels, divergences — you can plan trades around directly.
How do I add the Volumetric Toolkit to my charts?
It's freely available on the LuxAlgo Library. From this page you can also open it inside LuxAlgo's AI, Quant, and experiment with each feature.
Free indicator
Get free access to this indicator on the platforms below.

The Library is free. Quant makes it yours.
Pull any concept or indicator into Quant: rebuild it, retune it, or turn it into a backtested strategy of your own.