Concept
Volume Divergence
Volume Divergence is a Volume & Order Flow concept. The Library holds 1 implementation, a working definition you can pull into Quant.
Top Volume Divergence indicator
The top custom implementation, built on the original standard Volume Divergence formula.
1 total
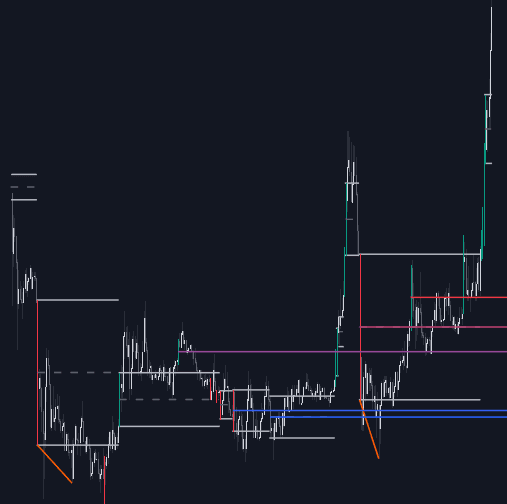
From studying Volume Divergence to trading it: take the implementation below into Quant and backtest it instantly.
What is Volume Divergence?
Volume divergence is a disagreement between price movement and the participation behind it: price presses to a new high or low while the volume fueling each successive push contracts. Because raw volume is unsigned (it says how much traded, not who initiated), the reading is about conviction and crowd participation rather than the direction of aggression. The premise is old: Dow theory holds that volume should confirm the trend, and Wyckoff's effort vs result treats volume as effort that ought to produce proportional price progress.
The label covers two mirror cases. Fading effort is successive trend legs on shrinking volume, suggesting the move is running out of participants. Wasted effort is heavy volume with little price progress, suggesting the aggressive side is being absorbed. Many implementations mechanize the idea by detecting divergence between price pivots and a smoothed volume series or volume oscillator. Either way it is a caution flag, not a timing signal: markets can drift a long way on thin volume, particularly in quiet sessions, so the divergence needs price confirmation before it becomes actionable.
Measurement conventions decide what the reading is worth. Comparing single peak bars is noisy; summing each leg's volume, or comparing smoothed activity at successive pivots, is steadier; and every comparison should hold session context constant, since an afternoon leg will lose a raw-volume contest against a morning leg for time-of-day reasons that have nothing to do with conviction. Mechanized detectors inherit whichever convention they encode, which is why two divergence indicators regularly disagree about the same chart.
The distinction that matters most in practice is divergence versus absorption. Shrinking volume into new extremes says participation is thinning, the classic fading-effort read; heavy volume with no progress says someone is taking the other side at scale, a different warning with different follow-ups. Unsigned volume alone cannot always separate the two, which is where signed views, volume delta and cumulative flow lines, earn their place next to the raw comparison.
How to identify Volume Divergence
Because raw volume has no direction, the comparison runs between successive pushes in the same direction rather than between two plotted lines.
- 1Mark two or more successive impulse legs in the trend: higher highs in an advance, or lower lows in a decline.
- 2Compare the volume that fueled each leg, using peak bar volume or summed leg volume, applied consistently; volume sliding lower on each new price extreme is the divergence.
- 3Cross-check the counter-moves: pullback volume expanding while impulse volume contracts strengthens the read.
- 4Treat it as context until price confirms with a structure break or a reversal pattern; thin-volume trends can extend much further than expected.
How traders use it
- As a trend health check: comparing volume on impulse legs against pullbacks, where expanding-with-trend is the healthy pattern, and its erosion is an early reason to tighten risk rather than to reverse position.
- To vet breakouts: a range break on contracting volume is widely treated as suspect, so traders either demand expansion (volume at breakout) or plan explicitly for the false breakout scenario.
- As reversal context: divergence into a well-defined support or resistance level, combined with a reversal bar or a break of structure, forms the classic exhaustion read.
- To disambiguate with signed data: pairing raw volume divergence with volume delta or a cumulative flow line helps separate fading participation from active absorption.
- With profile confirmation: successive highs printing progressively thinner distributions on the volume profile, value building lower while price presses higher, tells the same story as the leg-volume comparison from the where-at-price angle.
Volume Divergence vs related concepts
OBV Divergence: OBV signs each bar's volume by close direction and accumulates it, so its divergences blend price and volume into one line. Raw volume divergence keeps volume unsigned and compares magnitudes only.
Delta Divergence: Delta divergence uses executed buy-versus-sell flow, so it attributes aggression to a side. Volume divergence sees only totals, which is coarser but available on any chart without tick data.
Effort vs Result: Wyckoff's effort vs result is the general principle: volume is effort and price movement is result. Volume divergence is one specific expression of it, measured at successive swing highs and lows.
Concept family
Volume & Order Flow
88 concepts mapped · 88 in the Library
Volume Divergence FAQ
Turn Volume Divergence into a trading strategy.
Take the implementation from this page into Quant, then build on it, backtest it on real data, and keep refining it in conversation.