Accumulation vs Distribution Ranges
 By LuxAlgoFeb 23, 2026
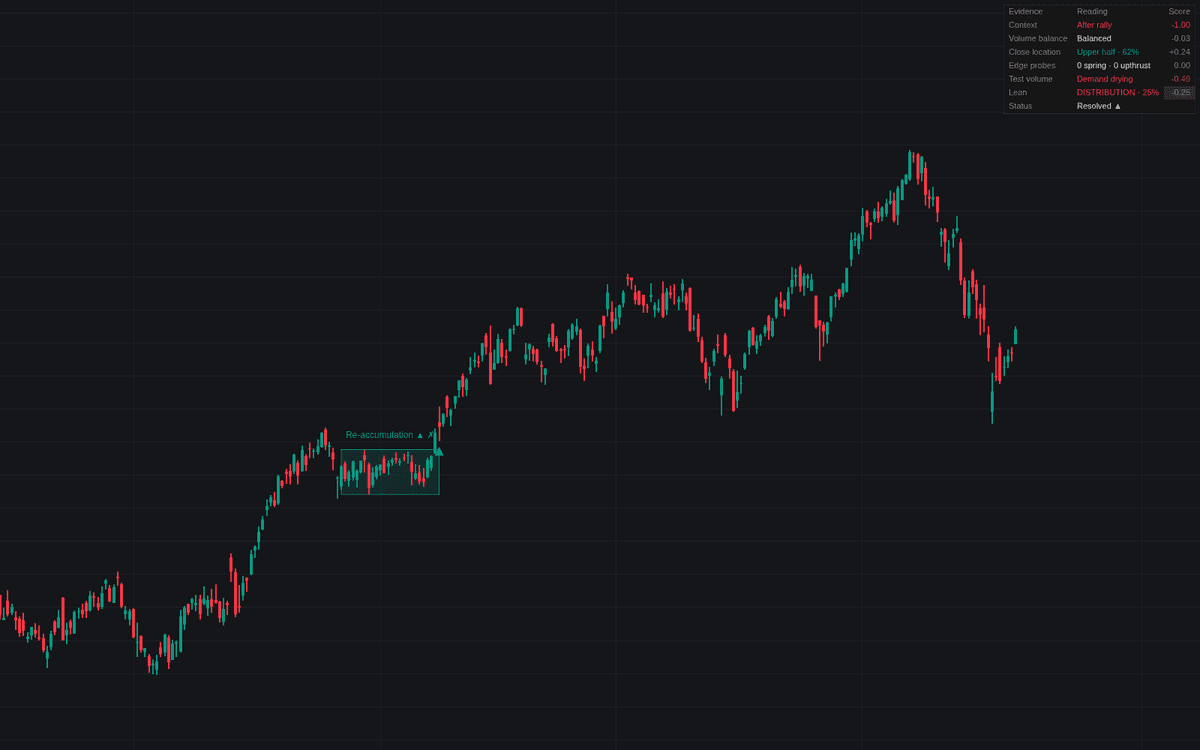

Accumulation vs Distribution Ranges classifies a consolidation while it forms instead of after the break. When a detection window stays compressed within a volatility threshold, the build boxes the range and weighs the evidence behind accumulation vs distribution ranges: the trend that led in, which side's moves run drier on volume, where closes sit, springs against upthrusts, and the volume drawn by boundary tests. The five scores average into a lean that recolors the range live, itemized on a dashboard.
How to Trade the Accumulation vs Distribution Ranges?
- Lean: the label reads Accumulation, Distribution or Undecided with a strength percentage, a hypothesis about which breakout to trust, not a signal.
- Springs and upthrusts: boundary violations that recover before confirmation print as circles and count as evidence.
- Resolution: consecutive closes beyond a boundary resolve the range. A triangle marks the bar and the label records the regime (including re-accumulation and re-distribution) with a verdict mark grading the lean.
The breakout is the final word; the evidence keeps the hypothesis explicit and gradeable.
Accumulation vs Distribution Ranges Settings
- Formation Length (default 20): bars in the detection window.
- ATR Length (default 200): volatility baseline for the compression test.
- Range Height Threshold (default 2.0): maximum window height in ATR multiples.
- Resolution Confirmation (default 2): consecutive closes beyond a boundary to resolve.
- Context Lookback (default 50): bars before the range measuring the prior trend.
- Edge Test Zone % (default 25): zone depth within which a bar counts as a boundary test.
- Lean Threshold (default 0.2): minimum average score before a lean is declared.
- Display: Show Evidence Dashboard (on) with Location (Top Right) and Size (Small), plus Show Range Labels, Mark Springs & Upthrusts and Mark Range Resolutions (all on).
Frequently Asked Questions

Original indicatorBuilt in-house by LuxAlgo
The Library is free. Quant makes it yours.
Pull any concept or indicator into Quant: rebuild it, retune it, or turn it into a backtested strategy of your own.