Concept
Accumulation vs Distribution Ranges
Accumulation vs Distribution Ranges are Market Structure concepts. The Library holds 1 implementation, a working definition you can pull into Quant.
Top Accumulation vs Distribution Ranges indicator
The top custom implementation, built on the original standard Accumulation vs Distribution Ranges formula.
1 total
From studying Accumulation vs Distribution Ranges to trading it: take the implementation below into Quant and backtest it instantly.
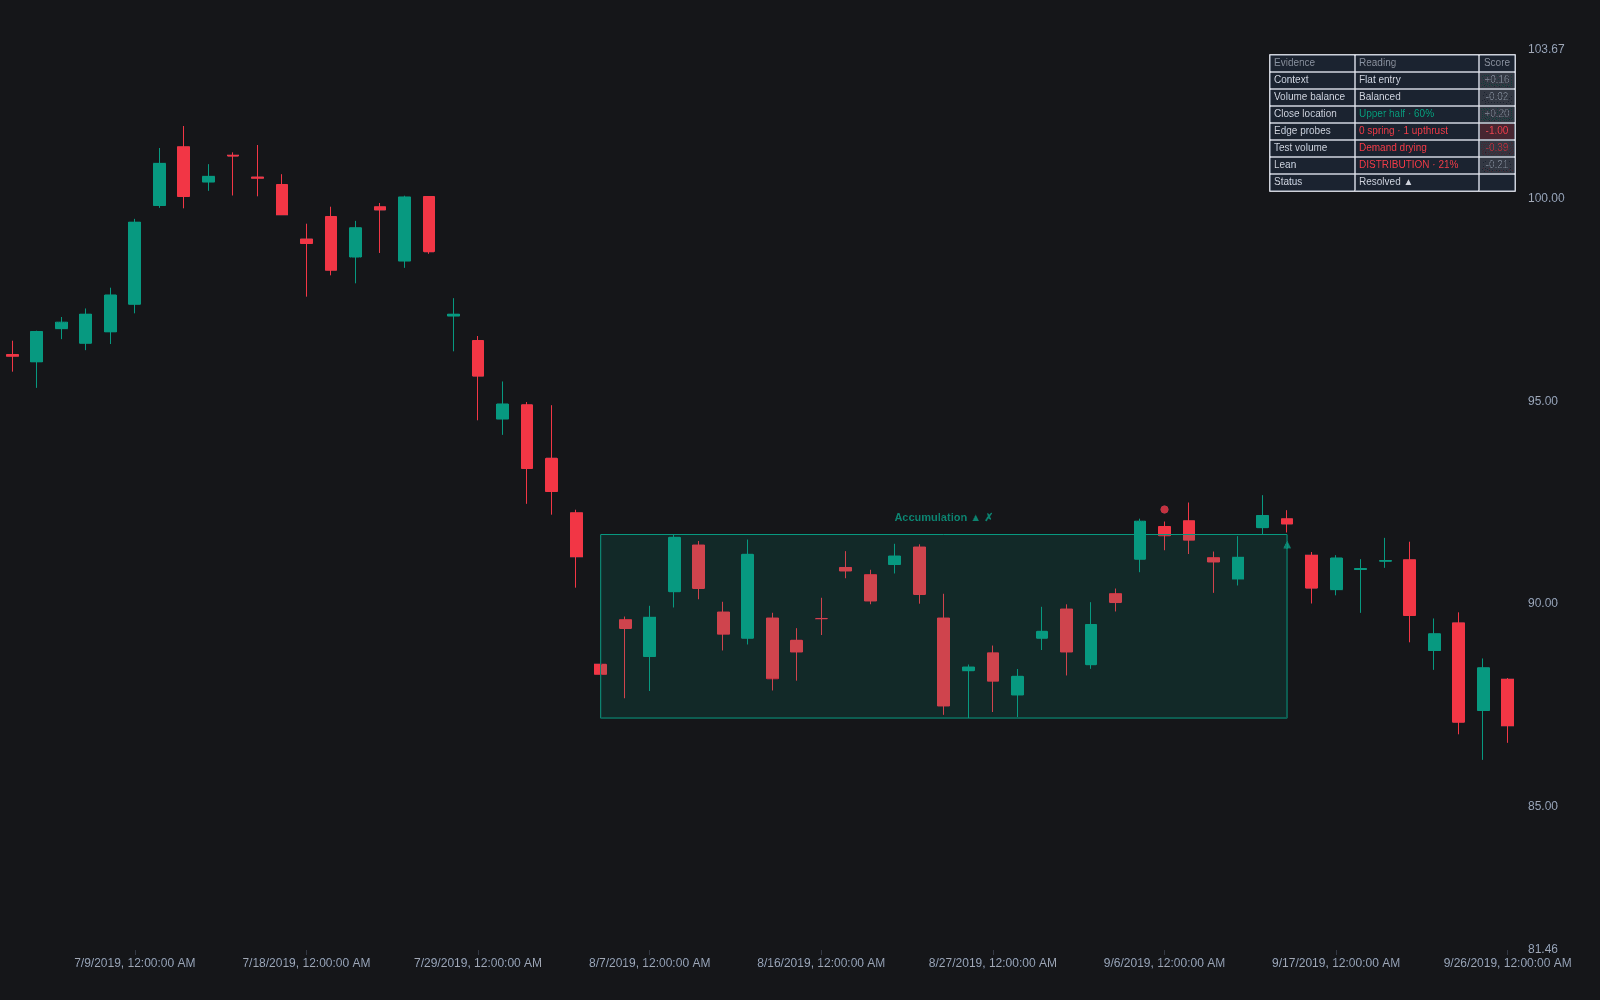
What are Accumulation vs Distribution Ranges?
In Wyckoff-derived analysis, a sideways range is not neutral ground: it is where large participants build or unload positions while price is contained. An accumulation range forms after a decline and absorbs selling ahead of a markup; a distribution range forms after a rally and feeds inventory to late buyers ahead of a markdown. The labels describe what the trading range ultimately resolves into, and the analytical task is inferring which process is underway from behavior inside the range, before the resolution makes it obvious.
The framework descends from Richard D. Wyckoff, the early twentieth-century trader and educator who systematized how large operators campaign into and out of positions. In his market cycle, accumulation precedes markup and distribution precedes markdown; the sideways phases do the inventory work between trends. The idea rhymes with the accumulation and distribution phases of Dow Theory, and much of today's structure vocabulary restates Wyckoff in newer terms.
The classical cues: where the range sits in the larger trend, how price behaves at the edges, and whether effort matches result. A spring, a brief shakeout below support that recovers, argues for accumulation; an upthrust, a failed push above resistance, argues for distribution. Shrinking volume on declines within the range favors the accumulation read, and shrinking volume on rallies favors the distribution read. The honest caveat: both range types look nearly identical for most of their life, and the label is only confirmed by the breakout and its follow-through.
Modern structure traders translate the same evidence into swing terms. Inside a candidate accumulation, breaks below prior swing lows stop following through, a change of character prints when a rally finally takes out a meaningful lower high, and the eventual break of structure beyond the range boundary marks the shift to markup. Reading a range through both lenses keeps the label anchored to observable events rather than narrative.
How to identify accumulation and distribution ranges on a chart
The label is a hypothesis assembled from context, edge behavior, and volume, then confirmed or denied by the resolution.
- 1Establish context first: a sideways container after a sustained decline is a candidate for accumulation, and one after a sustained rally a candidate for distribution.
- 2Draw the boundaries from the first major reaction high and low, expecting later tests to overshoot them rather than respect them to the tick.
- 3Grade the edge events: quick recoveries from dips below support (springs) count toward accumulation, failed probes above resistance (upthrusts) toward distribution; both are forms of deviation above or below the range.
- 4Compare volume on rallies against volume on declines inside the range to see which side works harder for less result.
- 5Treat the breakout as the verdict: expansion with follow-through validates the hypothesis, while a false breakout that collapses back inside argues the range needs relabeling.
How traders use it
- To set directional expectations for a range: evidence (position in the prior trend, springs versus upthrusts, volume on tests) is tallied toward an accumulation or distribution hypothesis, which then determines whether upside or downside breakouts are trusted.
- To trade range events rather than the middle: springs, upthrusts, and secondary tests near the edges offer defined-risk entries in the direction the range is presumed to resolve; these events overlap heavily with the swing failure pattern.
- To stay falsifiable: if a presumed accumulation range breaks down with expansion and holds below support, the hypothesis was wrong; classification remains provisional until markup or markdown is clearly underway.
- To keep timeframes honest: fractal nesting means a range on one timeframe is a pause inside a trend on the next one up, so multi-timeframe structure alignment decides whether the base case is accumulation, distribution, or continuation.
- To classify mid-trend pauses: ranges that form within an established trend and resolve with it are labeled re-accumulation or re-distribution, framing them as continuation structures rather than reversal attempts.
Accumulation/distribution ranges vs related concepts
Trading Range: The neutral container: sideways price between support and resistance, with no claim about intent. Accumulation versus distribution adds the directional hypothesis about who is absorbing inventory inside that container and which way it should resolve.
False Breakout: Any break of a boundary that fails and returns inside. Springs and upthrusts are false breakouts read for intent: their location, recovery speed, and volume become evidence about which side is absorbing.
Change of Character: A swing-level signal that the prevailing rhythm has flipped, such as the first strong break of a lower high after a decline. Inside a suspected range, it often supplies the earliest structural evidence for one label over the other.
Concept family
Market Structure
31 concepts mapped · 31 in the Library
Accumulation vs Distribution Ranges FAQ
Turn Accumulation vs Distribution Ranges into a trading strategy.
Take the implementation from this page into Quant, then build on it, backtest it on real data, and keep refining it in conversation.