Asset-class Seasonality
 By LuxAlgoApr 2, 2026
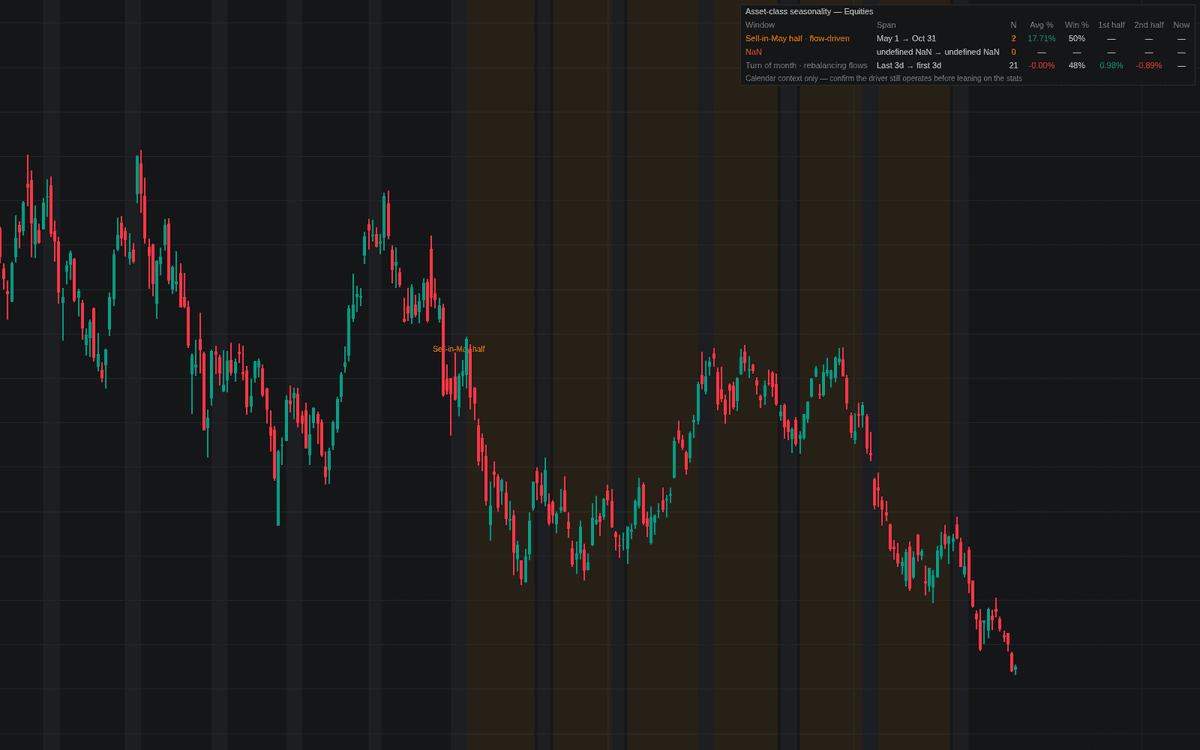

Asset-class Seasonality turns the driver-first logic of asset-class seasonality into named window templates: equity flow windows (sell-in-May half, turn-of-month rebalancing), grain weather-premium and harvest windows, natural gas withdrawal and injection seasons, the gasoline driving-season ramp, yen fiscal year-end and month-end fixes, or a custom annual and month-end window.
Every window is shaded and labeled, then scored on the symbol's own history in a dashboard: completed occurrences, mean window return, hit rate, an older-versus-newer-half stability split, and the running return of any open window.
How to Trade the Asset-class Seasonality?
- Window entry label: the driver name prints as its annual window opens. Context, not a signal.
- Stability split: same sign in both halves suggests persistence; a flipped sign warns the driver may be gone.
- N column tint: below 10 occurrences the row is flagged. Treat it as anecdote.
- Now column: the running return of the open window.
Pick the template matching the charted symbol (the same calendar shape means different things under different drivers) and run it on daily charts with long history, alongside the rest of the seasonality tooling.
Asset-class Seasonality Settings
- Asset class (default Equities): the driver template applied.
- Custom Window group (applies when the class is Custom Window): Annual window (default on), Window name, Start month (4), Start day (1), End month (7), End day (31), Month-end window (default off), Last days of month (3), First days of next month (0).
- Flag samples below (default 10): the small-sample tint threshold.
- Show dashboard (default on), with position and size options.
- Style toggles cover window shading (transparency 88), driver labels and the window colors.
Frequently Asked Questions

The Library is free. Quant makes it yours.
Pull any concept or indicator into Quant: rebuild it, retune it, or turn it into a backtested strategy of your own.