Turn-of-month Effects
 By LuxAlgoJun 12, 2026
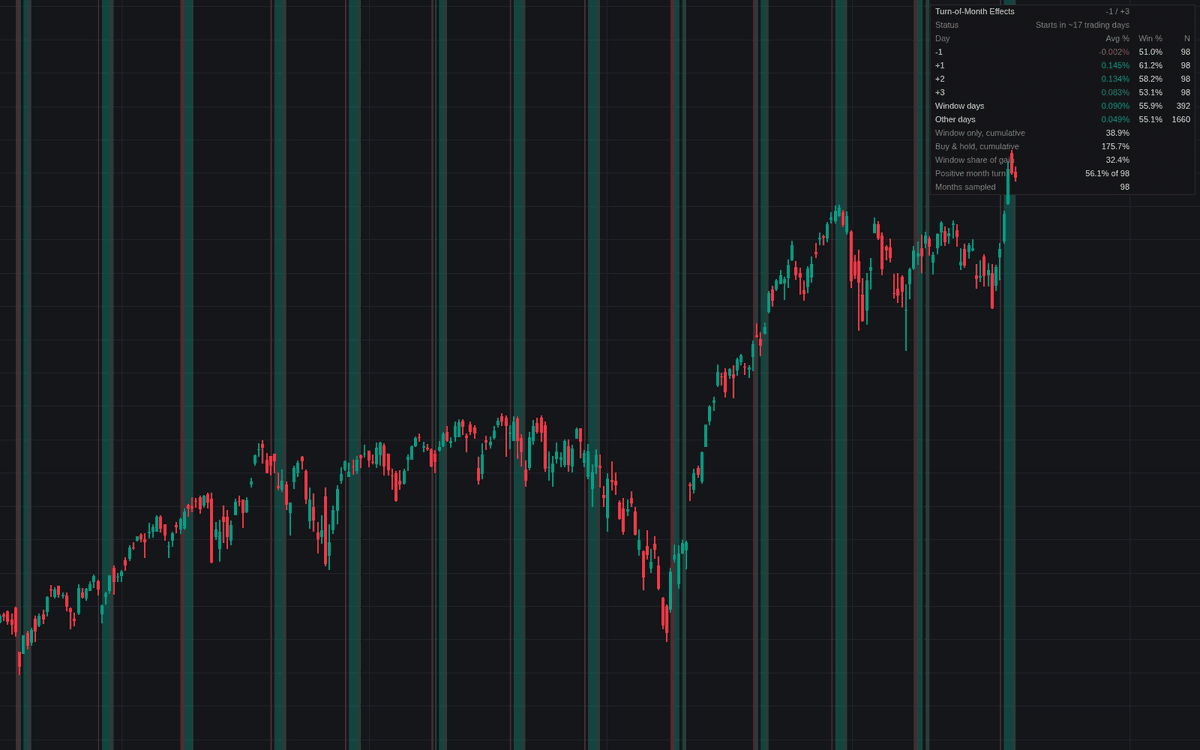

Turn-of-month Effects puts the calendar anomaly on the chart where it can be checked against the instrument actually traded. The window spans a configurable count of trading days on each side of the month boundary (the classic turn-of-month span of -1 through +3 by default), and every day inside it is shaded, tinted by that day position's historical mean when tinting is on. The dashboard carries the substance: per-position averages, win rates and sample sizes, window days against all others, and window-only versus buy-and-hold cumulative returns.
How to Trade the Turn-of-month Effects?
- Window start and end alerts: mark the boundary sessions for traders who time planned entries into the tilt, or hold shorts inside it to a higher bar.
- Day-by-day breakdown: each window day position carries its own statistics, so the window can be trimmed to the day positions that actually carried the tendency on this symbol.
- Window share of gain: the dashboard reports how much of the symbol's cumulative return accrued inside the window, the classic studies' headline number.
Turn-of-month Effects Settings
- Last Trading Days Of Old Month (default 1): sessions before the boundary; the classic academic definition uses only the final trading day.
- First Trading Days Of New Month (default 3): sessions after the boundary.
- Show Dashboard (on) and Show Day-By-Day Breakdown (on), with Location (Top Right) and Size (Small).
- Color Window By Historical Average Return (default on): per-day tint; disabled, the highlight stays a single neutral color.
- Show Day Position Labels (default off): prints -1, +1, +2 beneath the window bars.
- Window Transparency (default 85).
Frequently Asked Questions

Original indicatorBuilt in-house by LuxAlgo
The Library is free. Quant makes it yours.
Pull any concept or indicator into Quant: rebuild it, retune it, or turn it into a backtested strategy of your own.