Autocorrelation
 By LuxAlgoJun 5, 2026
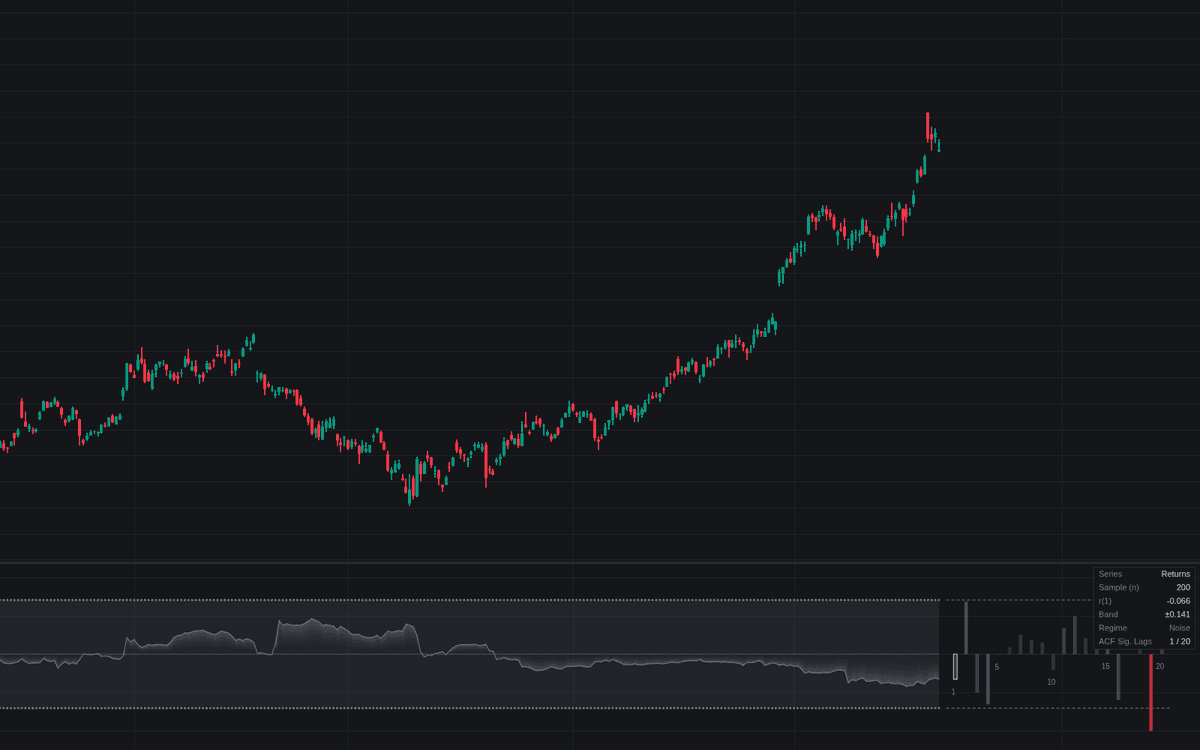

Autocorrelation measures whether a market's moves persist, snap back, or carry no memory, with error bars attached. It keeps a rolling sample of the analyzed series, computes its autocorrelation at the primary lag, and bands the reading at 2/sqrt(n), so a value only counts once it clears the noise floor. A correlogram beside the last bar draws one shaded column per lag (ACF, or PACF with shorter-lag influence stripped out), and the dashboard names the regime: Momentum, Mean Reversion, or Noise.
How to Trade the Autocorrelation?
- Above the upper band: significant follow-through, momentum-friendly conditions, alerted on the crossing.
- Below the lower band: significant snap-back, mean-reversion-friendly conditions, likewise alerted.
- Inside the bands: persistence indistinguishable from noise, the honest default, alerted when a regime fades back inside.
- Series picks the question: Returns reads persistence of direction, Squared or Absolute Returns volatility clustering, Detrended Price cycles.
Autocorrelation Settings
- Source (default close): price series feeding the analyzed series.
- Series (default Returns): also Squared Returns, Absolute Returns or Detrended Price.
- Detrend Length (default 20): moving average subtracted from price in Detrended Price mode; ignored otherwise.
- Sample Window (default 200): rolling sample size n. Longer tightens the bands but tracks regimes more slowly.
- Primary Lag (default 1): the lag plotted and monitored by the alerts; keep it well below the window.
- Show Correlogram (default on) with Lags (default 20) and Mode (default ACF): the per-lag profile.
- Show Dashboard (on) with Location (Top Right) and Size (Small); Gradient Fill (on).
Frequently Asked Questions

Original indicatorBuilt in-house by LuxAlgo
The Library is free. Quant makes it yours.
Pull any concept or indicator into Quant: rebuild it, retune it, or turn it into a backtested strategy of your own.