Hurst Exponent
 By LuxAlgoMay 1, 2026
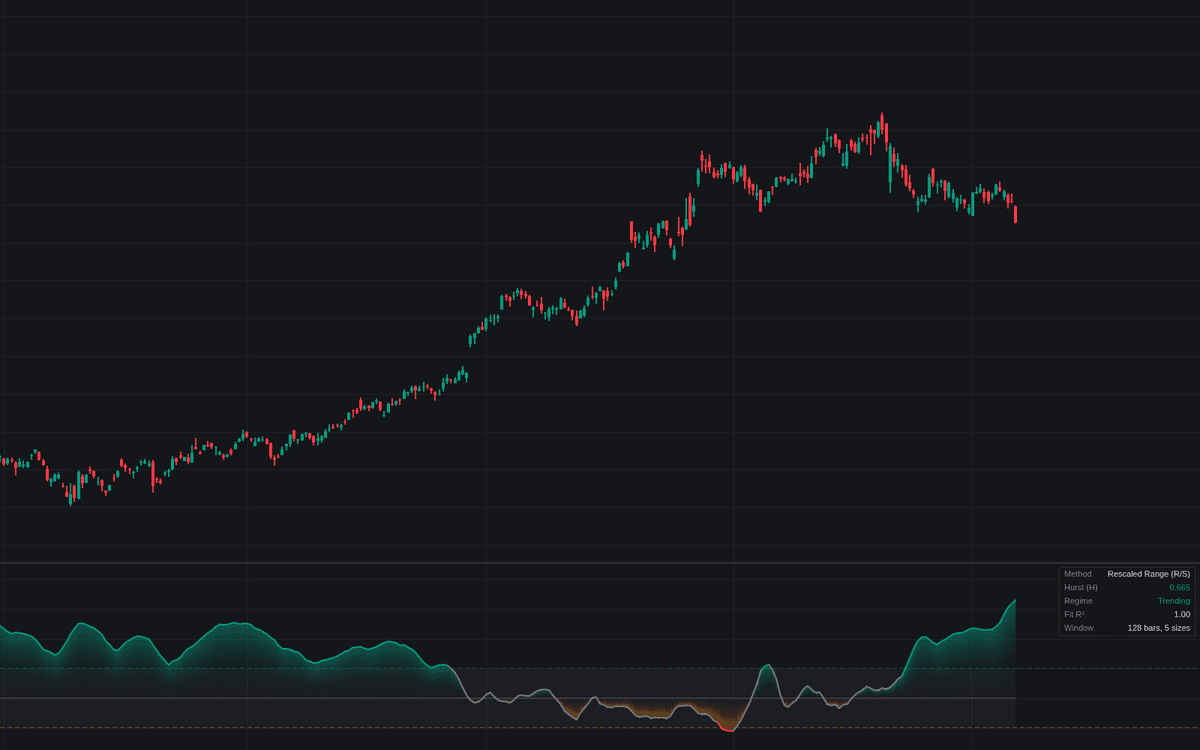

Hurst Exponent is the definitive clean build of the rolling Hurst exponent read. Each bar it runs classical rescaled-range analysis on the last 128 increments, fitting log R/S against log subsample size across dyadic scales; the fitted slope is H. Because raw rolling estimates jump, a smoothed series carries the regime read, and a neutral band around the 0.5 benchmark absorbs estimation noise: no regime is called until the smoothed H clears it. The line colors by state, and the dashboard quotes the reading with its method, window and log-log fit R².
How to Trade the Hurst Exponent?
- H above the band: persistent increments, the ground where trend-following approaches have a case.
- H below the band: anti-persistence. Moves lean toward giving part of the ground back, favoring fading and reversion tactics.
- H inside the band: random-walk territory; past direction carries no usable information, so both playbooks stand down.
- Regime alerts: fire on each crossing into trending, mean-reverting or neutral territory.
Like much of the statistics family, the reading is a tendency, not a precise number: a filter over strategies, not an entry.
Hurst Exponent Settings
- Source (default close): series the exponent is estimated on.
- Sample Length (default 128): rolling increments per estimate; longer is steadier but slower to adapt.
- Increments (default Log Returns): or Simple Differences for series that can be zero or negative.
- Smoothing Method (default SMA) with Smoothing Length (default 5): the smoothing that carries the regime read; 1 follows the raw estimate.
- Neutral Band Width (default 0.05): half-width of the noise band around 0.5.
- Dashboard & style: dashboard on, gradient fill on, raw estimate hidden by default.
Frequently Asked Questions

The Library is free. Quant makes it yours.
Pull any concept or indicator into Quant: rebuild it, retune it, or turn it into a backtested strategy of your own.