BandWidth
 By LuxAlgoJun 17, 2026
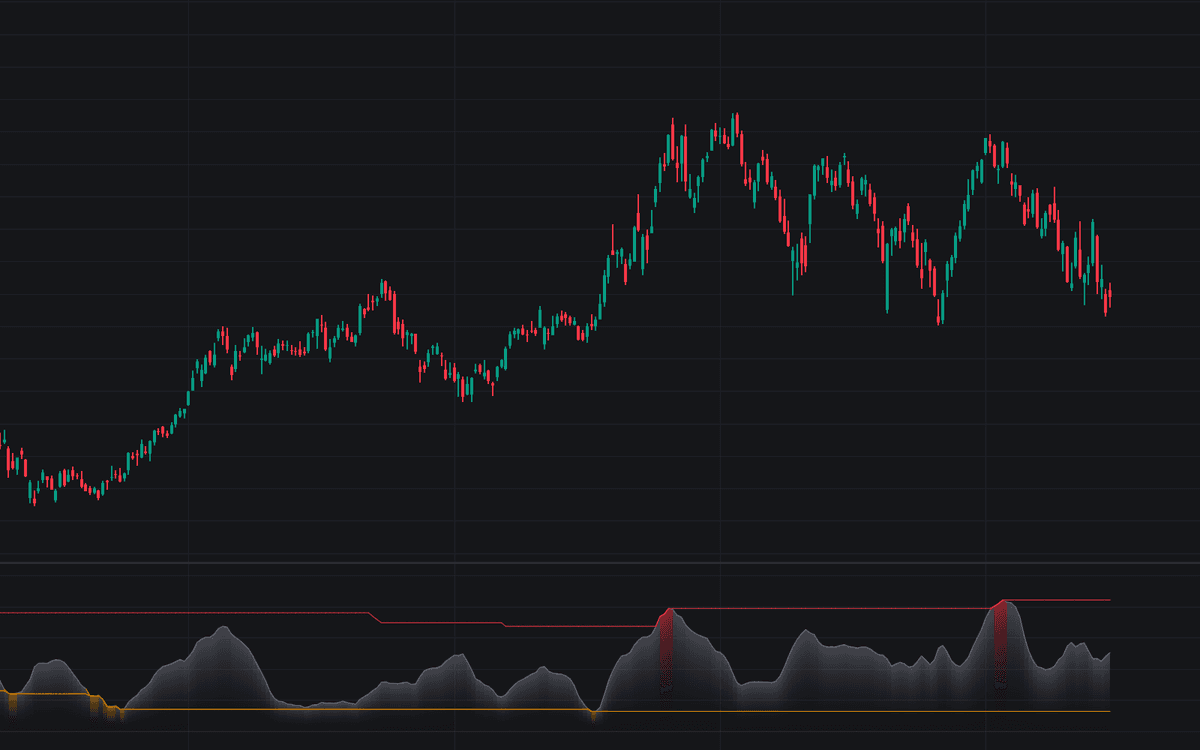

BandWidth is the definitive clean build of John Bollinger's BandWidth measure: the gap between upper and lower band as a fraction of the basis, plotted with a gradient fill above zero. Two reference lines track the lowest and highest readings of a configurable lookback (the Squeeze Level and Bulge Level), so the current width is always judged against its own recent extremes instead of an absolute level.
How to Trade the BandWidth?
- BandWidth at the Squeeze Level: volatility is unusually compressed (a condition, not a direction) and the environment where directional moves are often born.
- Expansion off the low: the Expansion From Squeeze Low alert fires when width turns up from its lookback low, the moment compression starts resolving.
- BandWidth at the Bulge Level: width this stretched is rarely sustained and frequently appears near trend endings, a prompt to protect profits rather than initiate.
- Direction comes from price: pair the width read with price structure or a breakout tool; the metric itself is deliberately non-directional.
BandWidth Settings
- Length (default 20): bars for the simple moving average basis and the standard deviation.
- Source (default close): price series the bands are computed from.
- Multiplier (default 2): standard deviation multiple, so the default bands sit four standard deviations apart.
- Reference Lookback (default 125): window locating the Squeeze and Bulge references, roughly six months of daily bars.
- Show Squeeze Level / Show Bulge Level (default on): plot the lookback low and high of BandWidth.
- Extreme Markers (default off): circles where BandWidth tags either reference; the alerts work regardless.
- Gradient Fill (default on): shades the area between zero and the BandWidth line.
Frequently Asked Questions

Original indicatorBuilt in-house by LuxAlgo
The Library is free. Quant makes it yours.
Pull any concept or indicator into Quant: rebuild it, retune it, or turn it into a backtested strategy of your own.