Concept
BandWidth
BandWidth is a Volatility concept. The Library holds 1 implementation, a working definition you can pull into Quant.
Top BandWidth indicator
The top custom implementation, built on the original standard BandWidth formula.
1 total
This BandWidth implementation is strategy-ready: open it in Quant, set your rules, and it backtests automatically.
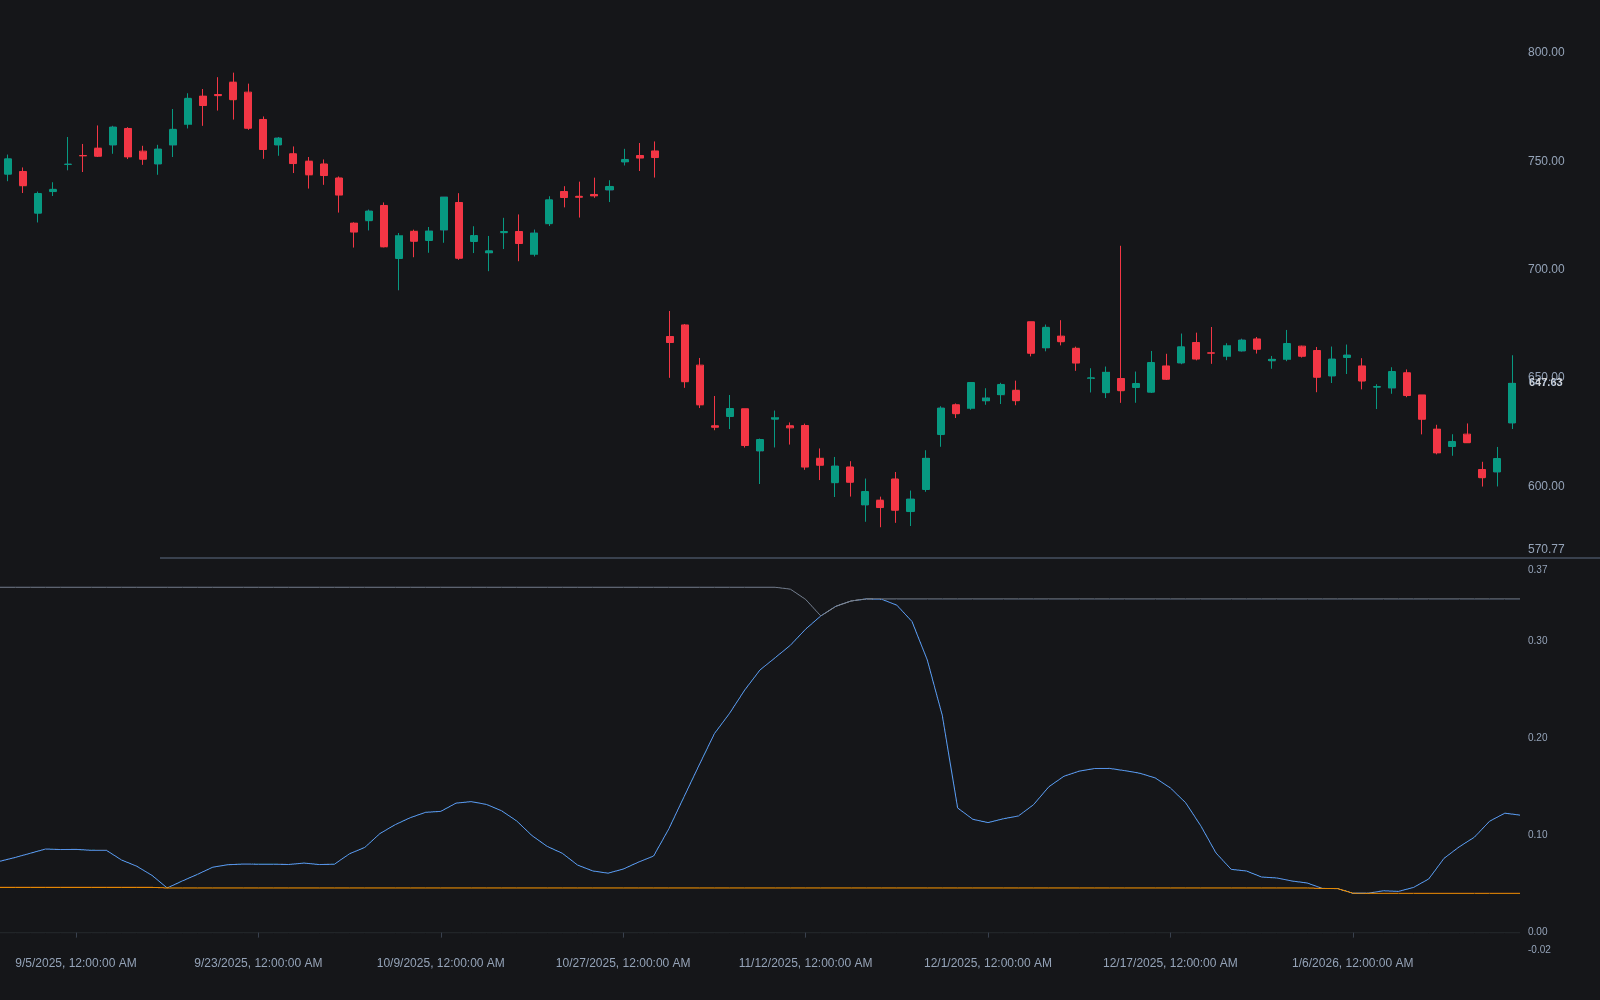
What is BandWidth?
BandWidth is John Bollinger's normalized measure of how wide Bollinger Bands are: upper band minus lower band, divided by the middle band. With default parameters (a 20-period SMA basis and bands two standard deviations away), the numerator spans four standard deviations of price, so BandWidth is relative volatility expressed as a fraction of the average. Dividing by the middle band is what makes readings comparable across instruments and price levels; a raw band span in points is not.
Bollinger defined it to formalize two of his observations. The Squeeze: when BandWidth falls to its lowest level in around six months of daily data (roughly 125 sessions), volatility is unusually compressed, a condition that often precedes the birth of a directional move. The Bulge: extreme high readings mark volatility that is unlikely to be sustained, frequently appearing near trend endings. Both are conditions rather than signals. The Squeeze in particular says nothing about direction, and Bollinger himself documented the head fake, an initial break opposite the eventual move.
The measure earns its keep because volatility is cyclical: quiet periods breed expansion and expansion exhausts itself back into quiet, so a normalized width oscillates in slow waves that raw price never shows directly. That is also the honest caveat about the Squeeze: compression can persist, a dead market printing new width lows for weeks, so the condition builds a watchlist rather than a countdown. Bollinger's own presentation, laid out in his Bollinger on Bollinger Bands book, treats width analysis as preparation, with direction always delegated to price action and confirming tools.
The construction generalizes beyond price. Bands can wrap any series, and LazyBear's RSI Bands study carries the full kit onto the oscillator, RSI bands, an RSI %B, and an RSI BandWidth whose compressions flag momentum coiling the same way price BandWidth flags price coiling. On price itself, the width read sits alongside relatives: realized volatility measures what movement actually occurred while BandWidth tracks the bands' statistical casing, and ATR-based widths incorporate gaps that close-based standard deviation never sees. Ranking any of them against their own history is what turns a raw number into a regime read.
How to identify BandWidth readings
The number only means something against its own history, so identification is normalization plus ranking.
- 1Compute the bands: a 20-period basis with bands two standard deviations away is the convention the definitions assume.
- 2Take the width: upper minus lower, divided by the middle band, optionally times 100 for readability.
- 3Rank it against the instrument's own history: percentile position or distance from the long-lookback extremes.
- 4Flag the conditions: a low around the 125-session minimum is Squeeze territory, an extreme high after a long advance is Bulge territory.
- 5Delegate direction: width says the market is coiled or overstretched, and price action, structure, or volume must say which way that resolves.
How it's calculated
The width of the Bollinger Bands expressed as a fraction of the middle band, making volatility comparable across time and instruments.
Bollinger specifies the population standard deviation (divide by n, not n - 1).
Many platforms multiply by 100 and quote BandWidth in percent.
Bollinger defines a squeeze as BandWidth at its lowest level in roughly 125 bars; %b is the companion measure of where price sits inside the bands.
How traders use it
- Squeeze scanning: screeners flag instruments whose BandWidth just printed a long-lookback low, building a watchlist of compressed charts before the Bollinger Squeeze resolves.
- Breakout confirmation: after a squeeze, expanding BandWidth alongside a range break supports the move being genuine, while a break on flat width is more suspect; the head-fake risk of a false breakout argues for confirmation over anticipation.
- Trend maturity: width stretched far above its own norm after a sustained advance warns the move is mature; Bollinger tied trend endings to the Bulge, extreme width that tends not to be sustained.
- Normalized comparison: because it is a ratio, BandWidth can be ranked against its own history as a volatility percentile or compared across a watchlist to surface the quietest and loudest charts.
- On other series: bands drawn around an oscillator give that oscillator its own BandWidth, so momentum compression can be tracked with the same squeeze-and-release grammar used on price.
BandWidth vs. related measures
%B: Bollinger's other derivative answers a different question: %B locates price within the bands, BandWidth measures how far apart the bands are. One is position, the other is width; squeeze work uses BandWidth, overbought/oversold work uses %B.
TTM Squeeze: The TTM version defines compression externally: Bollinger Bands trading inside Keltner Channels. BandWidth defines it internally, as a low reading relative to the band's own history, and the two definitions can disagree at the margin.
Donchian Width: Donchian Width measures the high-to-low span of a lookback window, an extremes-based range measure. BandWidth is standard-deviation based, so a single spike bar moves the two very differently.
Concept family
Volatility
57 concepts mapped · 57 in the Library
BandWidth FAQ
Turn BandWidth into a trading strategy.
Take the implementation from this page into Quant, then build on it, backtest it on real data, and keep refining it in conversation.