%B
 By LuxAlgoJun 11, 2026
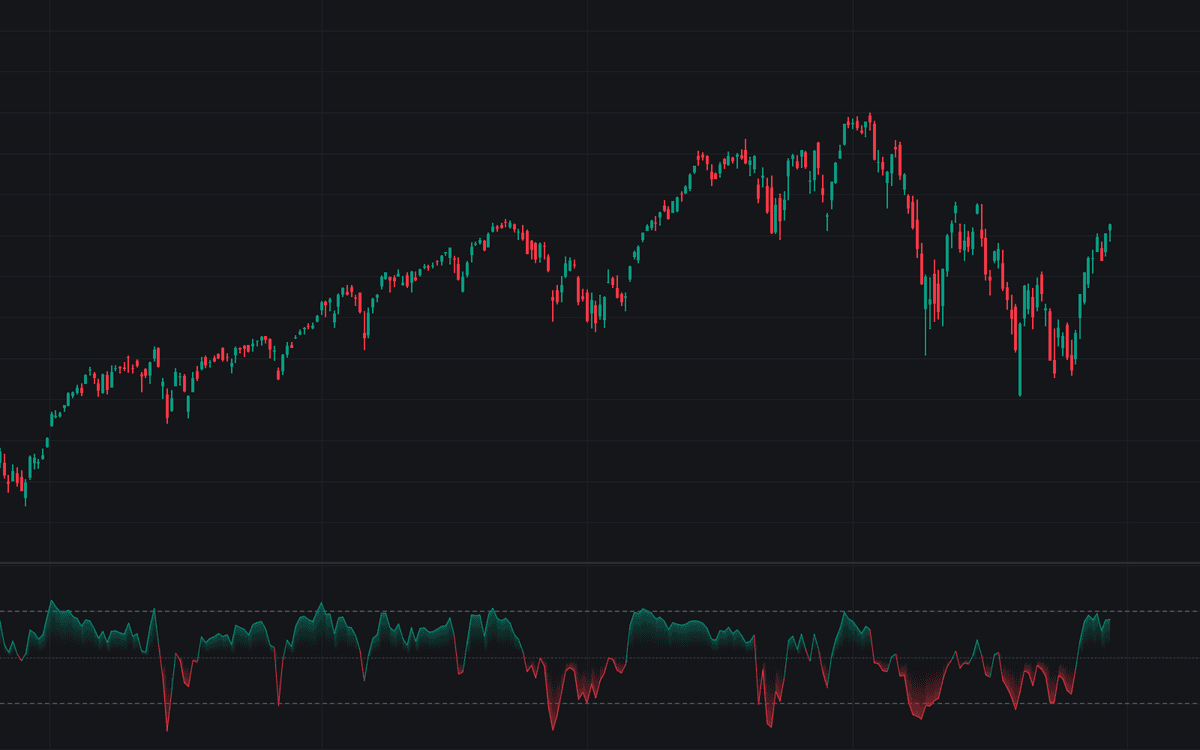

%B collapses Bollinger Band position into one oscillator value: 1 means price sits on the upper band, 0 on the lower, 0.5 on the moving-average basis, and anything beyond those bounds says price has moved outside the bands. This is the definitive clean build of the %B statistic: bands come from a 20-bar simple moving average with a 2x standard-deviation offset; the line is colored bullish above the 0.5 midline, bearish below it, and a gradient fill anchors each reading to the midline.
How to Trade the %B?
- %B above 1: price is outside the upper band: uncommon, but a strong trend can pin readings there while price walks the band, so read it as strength first and stretch second.
- %B below 0: price is outside the lower band, the mirrored oversold condition.
- Midline crosses: a move through 0.5 marks price reclaiming or losing the basis, a simple bias filter between band tags.
- Threshold exits: crossing back inside 1 or 0 marks price pulling back within the bands; the exit is often more actionable than the entry.
Six alerts cover threshold entries and exits plus both midline crosses; optional markers circle bars held beyond a threshold.
%B Settings
- Length (default 20): bars for the basis average and standard deviation; shorter reacts faster, longer smooths.
- Source (default close): price series the bands and %B are computed from.
- Multiplier (default 2): standard-deviation multiplier. %B is derived entirely from the bands, so everything inherits it.
- Overbought (default 1) and Oversold (default 0): thresholds; move them inward to flag approaches before a band tag.
- Extreme Markers (default disabled): circles on readings beyond a threshold.
- Gradient Fill (default enabled): gradient between %B and the midline; remaining Style inputs set colors.
Frequently Asked Questions

The Library is free. Quant makes it yours.
Pull any concept or indicator into Quant: rebuild it, retune it, or turn it into a backtested strategy of your own.