Bid/ask Imbalance
 By LuxAlgoJun 14, 2026
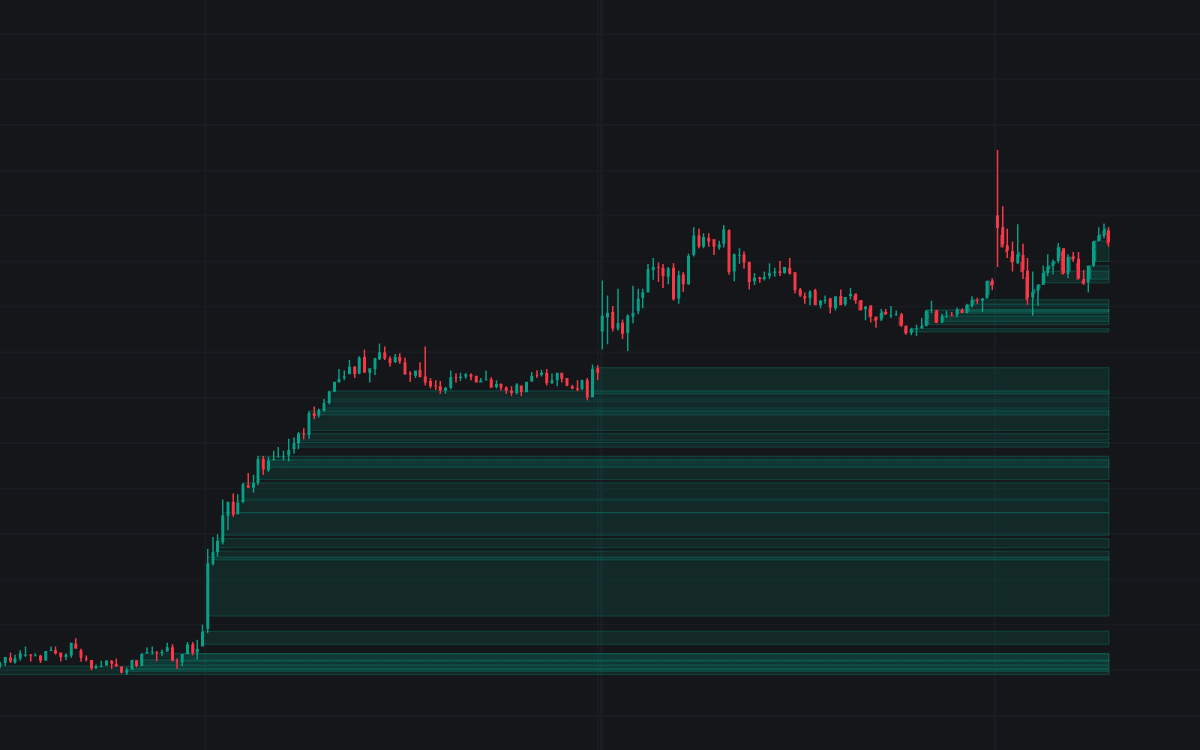

Bid/ask Imbalance is the definitive chart build of the footprint bid/ask imbalance read: each bar is reconstructed from a lower timeframe into price levels of ask- versus bid-executed volume, and the diagonal comparison (ask volume at each level against bid volume one level below) flags where aggression cleared the ratio. Buy flags highlight the ask half of the bar, sell flags the bid half, and consecutive same-side flags outline stacked bands extended right as prospective support or resistance.
How to Trade the Bid/ask Imbalance?
- Stacked bands over single flags: an isolated flag is noise-prone; three or more consecutive levels mark a band where aggression ran through passive liquidity.
- Watch the first return: once price trades clear of a band, its first trip back finds defense, confirming it, or cuts through; both have alerts.
- A close through the far side retires the band: the aggressive side was soaked up or moved on; the band is removed, or kept faded if configured.
Bid/ask Imbalance Settings
- Auto Intrabar Timeframe (default on) with Custom Intrabar Timeframe (default 1): the lower timeframe the footprint is built from.
- Price Levels per Bar (default 10): rows each bar's range is divided into.
- Imbalance Ratio (default 3): diagonal multiple to flag a level, the common 300% setting.
- Minimum Volume % (default 2): floor on the flagged side as a share of bar volume; near-empty levels cannot trigger.
- Stacked Levels (default 3): consecutive same-side flags required for a band.
- Stacked Imbalance Bands (default on) and Keep Broken Bands (default off): band drawing and their afterlife.
- Imbalance Marks (default on) with Mark History (Bars) (default 50): per-level highlights and their persistence.
Frequently Asked Questions

Original indicatorBuilt in-house by LuxAlgo
The Library is free. Quant makes it yours.
Pull any concept or indicator into Quant: rebuild it, retune it, or turn it into a backtested strategy of your own.