Concept
Bid/ask Imbalance
Bid/ask Imbalance, also known as stacked imbalances, is a Volume & Order Flow concept. The Library holds 1 implementation, a working definition you can pull into Quant.
Top Bid/ask Imbalance indicator
The top custom implementation, built on the original standard Bid/ask Imbalance formula.
1 total
The Bid/ask Imbalance implementation below can become a backtested trading strategy — describe your rules and Quant writes the code.
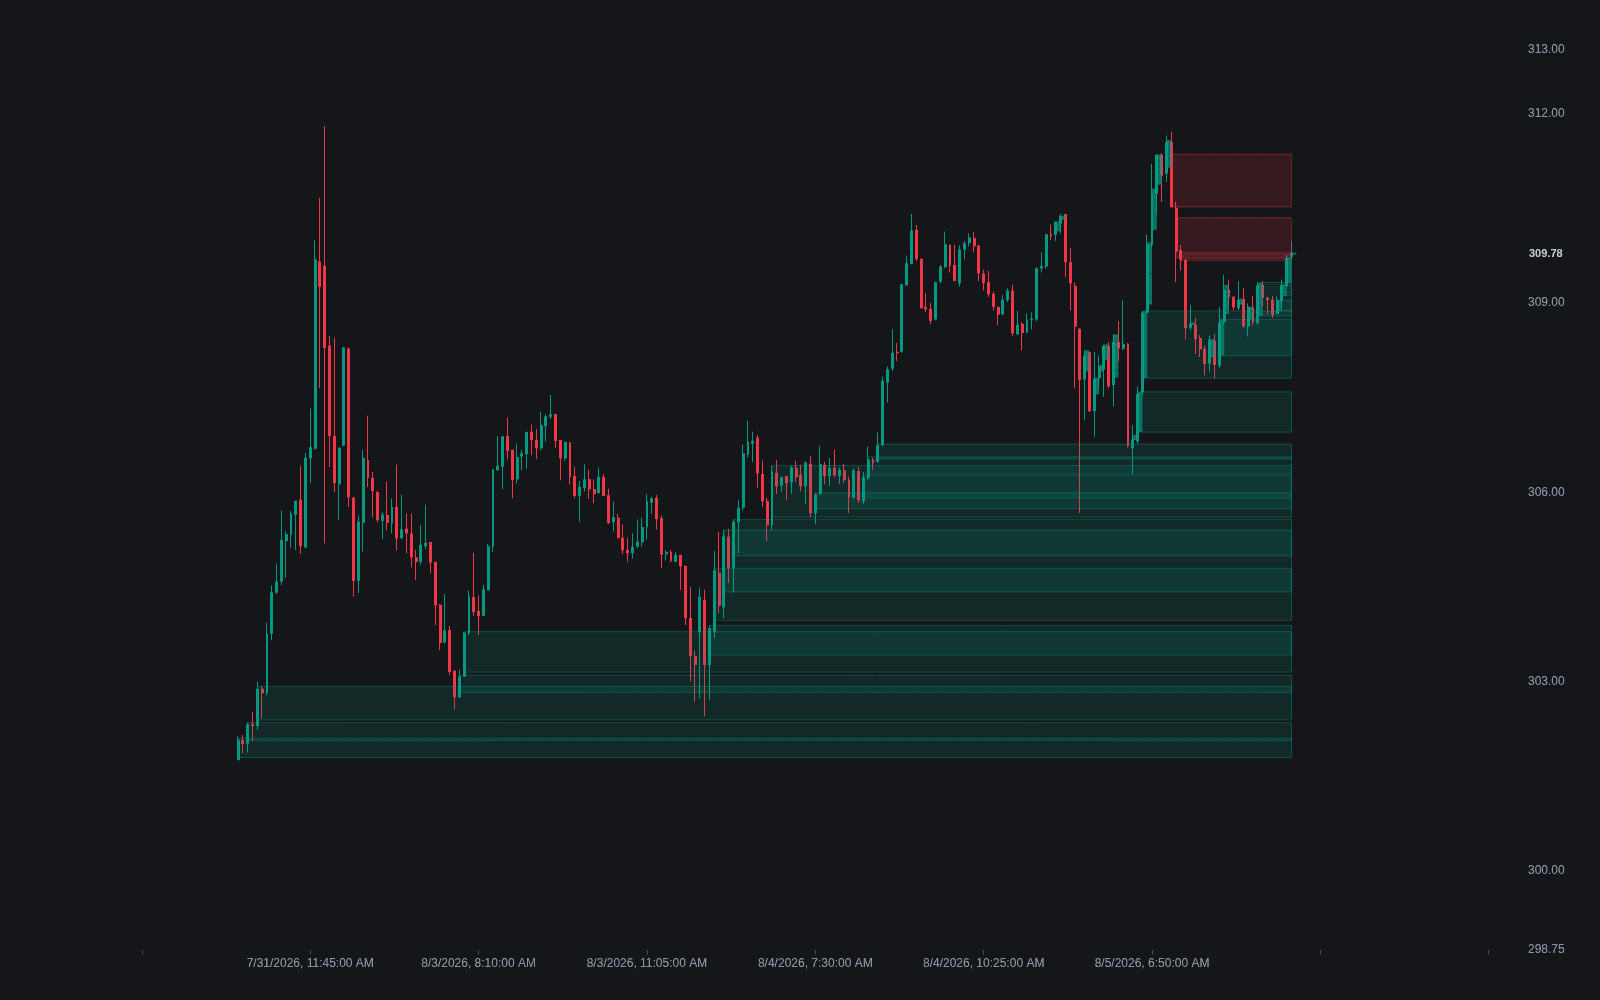
What is a Bid/ask Imbalance?
A bid/ask imbalance is a footprint chart reading that flags price levels where one side traded far more aggressively than the other. The comparison is diagonal: volume executed at the ask at one price is measured against volume executed at the bid one tick lower, because aggressive buyers lift the offer at one level while aggressive sellers hit the bid just beneath it. When the ratio clears a threshold, commonly around 300% (3:1), the level is flagged as a buy or sell imbalance.
The reading grew out of the footprint chart itself, popularized in the early 2000s by MarketDelta, whose founder Trevor Harnett is widely credited with the format. Splitting each bar's volume into bid-executed and ask-executed amounts at every price made per-level aggression measurable, and imbalance detection is now standard in order-flow platforms and in TradingView approximations. The prerequisite is aggressor-tagged data: where a feed lacks true bid/ask attribution, tools fall back on tick-rule estimates and the flags become approximations.
Single imbalances are noise-prone, so order-flow traders weight stacked imbalances: three or more consecutive price levels imbalanced in the same direction. A stack outlines a band where aggression overwhelmed passive liquidity, and such bands are often treated as intrabar support or resistance on retests. Thresholds, minimum-volume filters, and stack counts are all configurable.
The appeal is granularity. A bar's volume delta nets aggression across the whole bar; imbalances localize it to exact prices, showing where within the bar initiative buyers or sellers did their work. None of it guarantees a level holds. An imbalance describes what happened in the auction, not what must happen next, and an imbalance pressed into a larger opposing level is routinely absorbed.
How to identify bid/ask imbalances on a chart
You need a footprint (bid x ask) chart built from aggressor-tagged trade data:
- 1Display bars as bid/ask footprints and set an imbalance threshold, commonly 300%, plus a minimum-volume filter so near-empty levels cannot trigger flags.
- 2Read diagonally: compare ask volume at each price against bid volume one tick below; qualifying levels highlight as buy imbalances on the ask side or sell imbalances on the bid side.
- 3Look for stacks of three or more consecutive flagged levels on the same side and mark the price band they span.
- 4Note where the stack printed: at the origin of a breakout, into a prior point of control, or at the edge of the value area; location assigns meaning.
- 5Watch the first retest of the band. Defense confirms it as intrabar support or resistance; a clean trade-through says the aggressors were absorbed or have left.
How traders use it
- Mapping intrabar support and resistance: stacked buy imbalances outline zones where aggressive buyers ran through passive sellers, and traders watch whether price defends those zones on the first retest rather than assuming it will.
- Confirming aggression behind a move: a breakout or level retest that prints fresh imbalances in the direction of travel shows initiative order flow, complementing bar-level checks like volume at breakout, while a move without them suggests thin participation.
- Spotting absorption: repeated buy imbalances that fail to lift price imply passive sellers are soaking up the aggression, a warning that the buyers may be trapped; the same read applies inverted for sell imbalances.
- Framing entries at pre-marked levels: stacks that print as price returns to a session VWAP, a high-volume node, or a profile edge show whether the level is actually being defended rather than merely touched.
- Cross-checking the session: when a delta profile shows net aggression by price agreeing with the side of the stacks, the intrabar and session-level reads reinforce each other.
Bid/ask imbalances vs. related order-flow reads
Volume Delta: Volume delta nets buy and sell aggression over an entire bar into one number. A bid/ask imbalance keeps the price dimension, flagging the exact levels where aggression was lopsided; delta summarizes what imbalances itemize.
Delta Profile: A delta profile accumulates net aggression by price across a session, a standing map rather than a per-bar flag. Imbalances are the raw events; the delta profile is one way their footprint aggregates over time.
Volume Profile: A volume profile shows how much traded at each price with no aggressor split, mapping acceptance rather than initiative. Imbalances answer who pushed; the profile answers where the market spent its time.
Concept family
Volume & Order Flow
88 concepts mapped · 88 in the Library
Bid/ask Imbalance FAQ
Turn Bid/ask Imbalance into a trading strategy.
Take the implementation from this page into Quant, then build on it, backtest it on real data, and keep refining it in conversation.