Buyback Blackout Windows
 By LuxAlgoJul 23, 2026
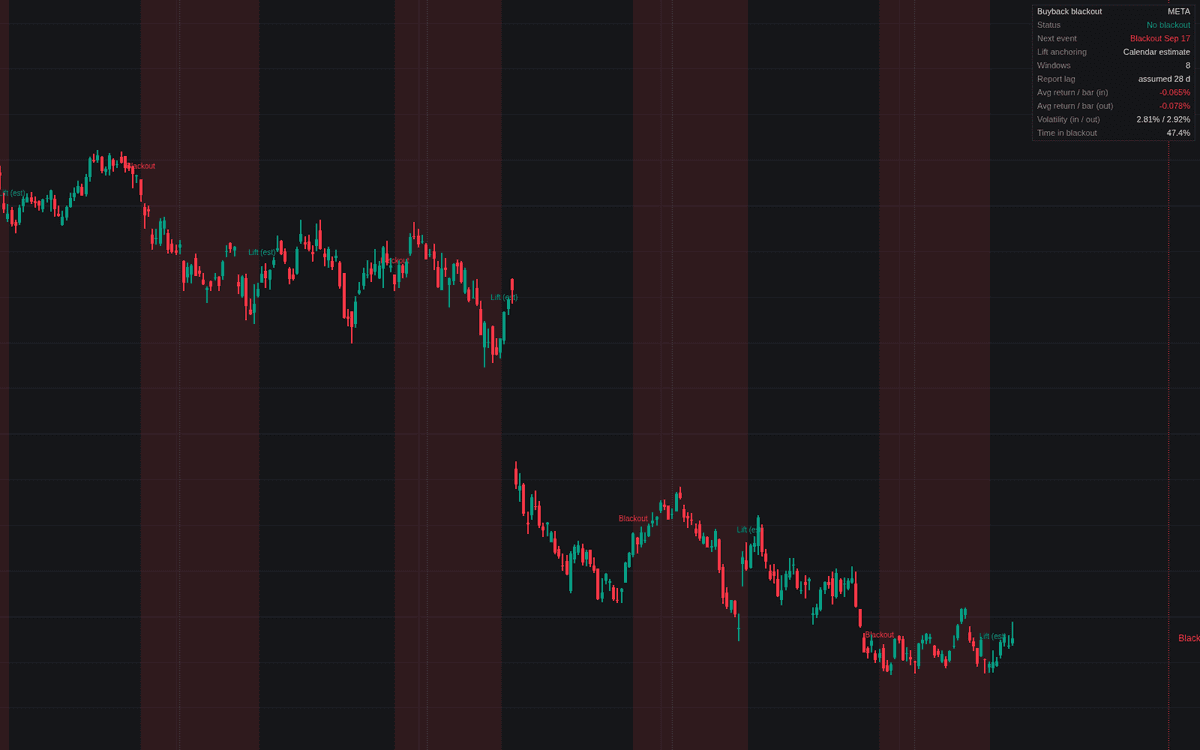

Buyback Blackout Windows brings buyback blackout windows, the recurring self-imposed pauses in discretionary corporate repurchases around earnings, to the chart for the first time. Each window opens a set number of days before the fiscal quarter end and lifts a set number of days after the earnings release, anchored to listed dates when provided, and to an estimated report lag otherwise. The build shades each window, labels entries and lifts, marks earnings dates and quarter-end boundaries, projects the next transition, and compares returns and volatility inside versus outside the windows.
How to Trade the Buyback Blackout Windows?
- Blackout label and shading: the discretionary corporate bid is assumed off. Flow context into earnings, never a standalone signal; pre-set programs keep executing.
- Lift label: discretionary buying can typically resume; "(est)" means no listed date anchored the window.
- Next event projection: the dotted guide dates the coming entry or lift before it arrives.
- Dashboard in/out rows: average return and volatility inside versus outside windows. Evidence is mixed, so let the local numbers speak.
Buyback Blackout Windows Settings
- Fiscal Quarter-End Months (default Mar / Jun / Sep / Dec): off-cycle reporters pick the matching shifted cycle.
- Entry: Days Before Quarter End (default 14): when each window opens.
- Lift: Days After Earnings Release (default 2): when it closes.
- Estimated Report Lag (Days) (default 28): assumed quarter-end-to-release gap when no date is listed.
- Earnings Dates (Optional) (default empty): comma-separated YYYY-MM-DD releases that anchor lifts to actual publication.
- Date Matching Horizon (Days) (default 60): how far past a quarter end a listed date may sit and still anchor that window.
- Style toggles cover shading, labels, earnings markers, quarter-end lines, projection, and dashboard.
Frequently Asked Questions

Original indicatorBuilt in-house by LuxAlgo
The Library is free. Quant makes it yours.
Pull any concept or indicator into Quant: rebuild it, retune it, or turn it into a backtested strategy of your own.