Candle Breakout Oscillator
 By LuxAlgoMay 28, 2025
Candle Breakout Oscillator is an indicator on Vela, our next-generation charting platform, written in Pine Script®.
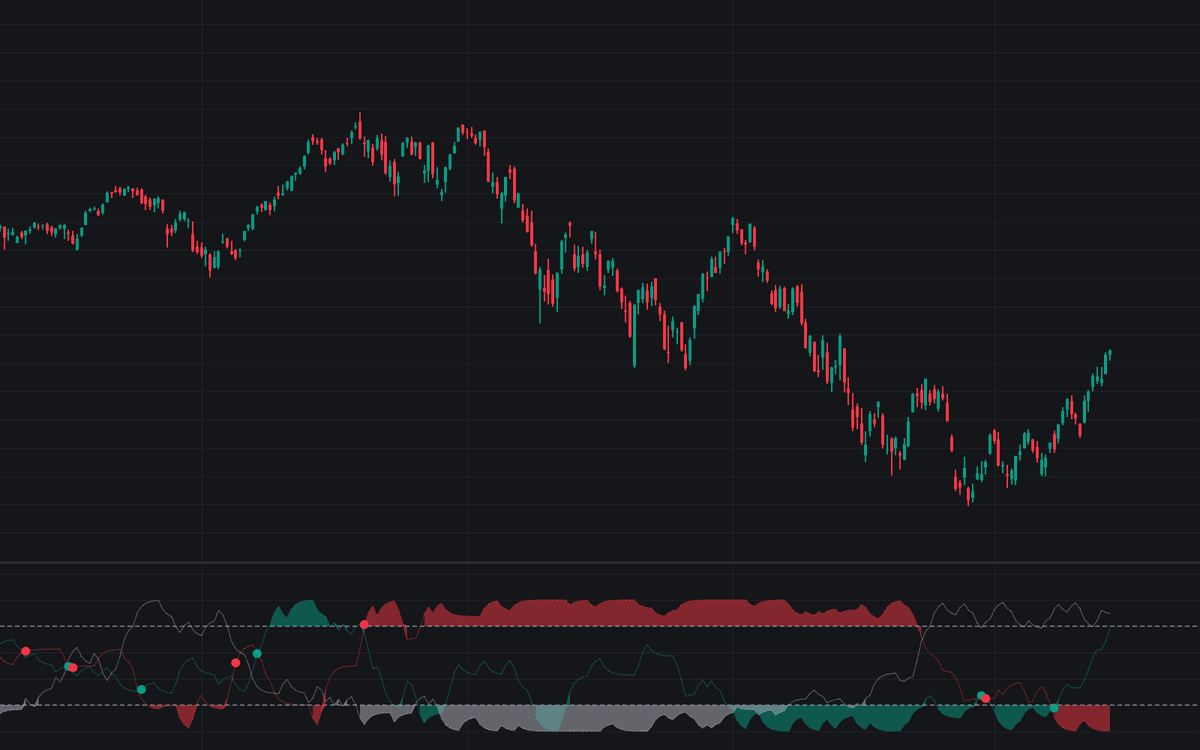

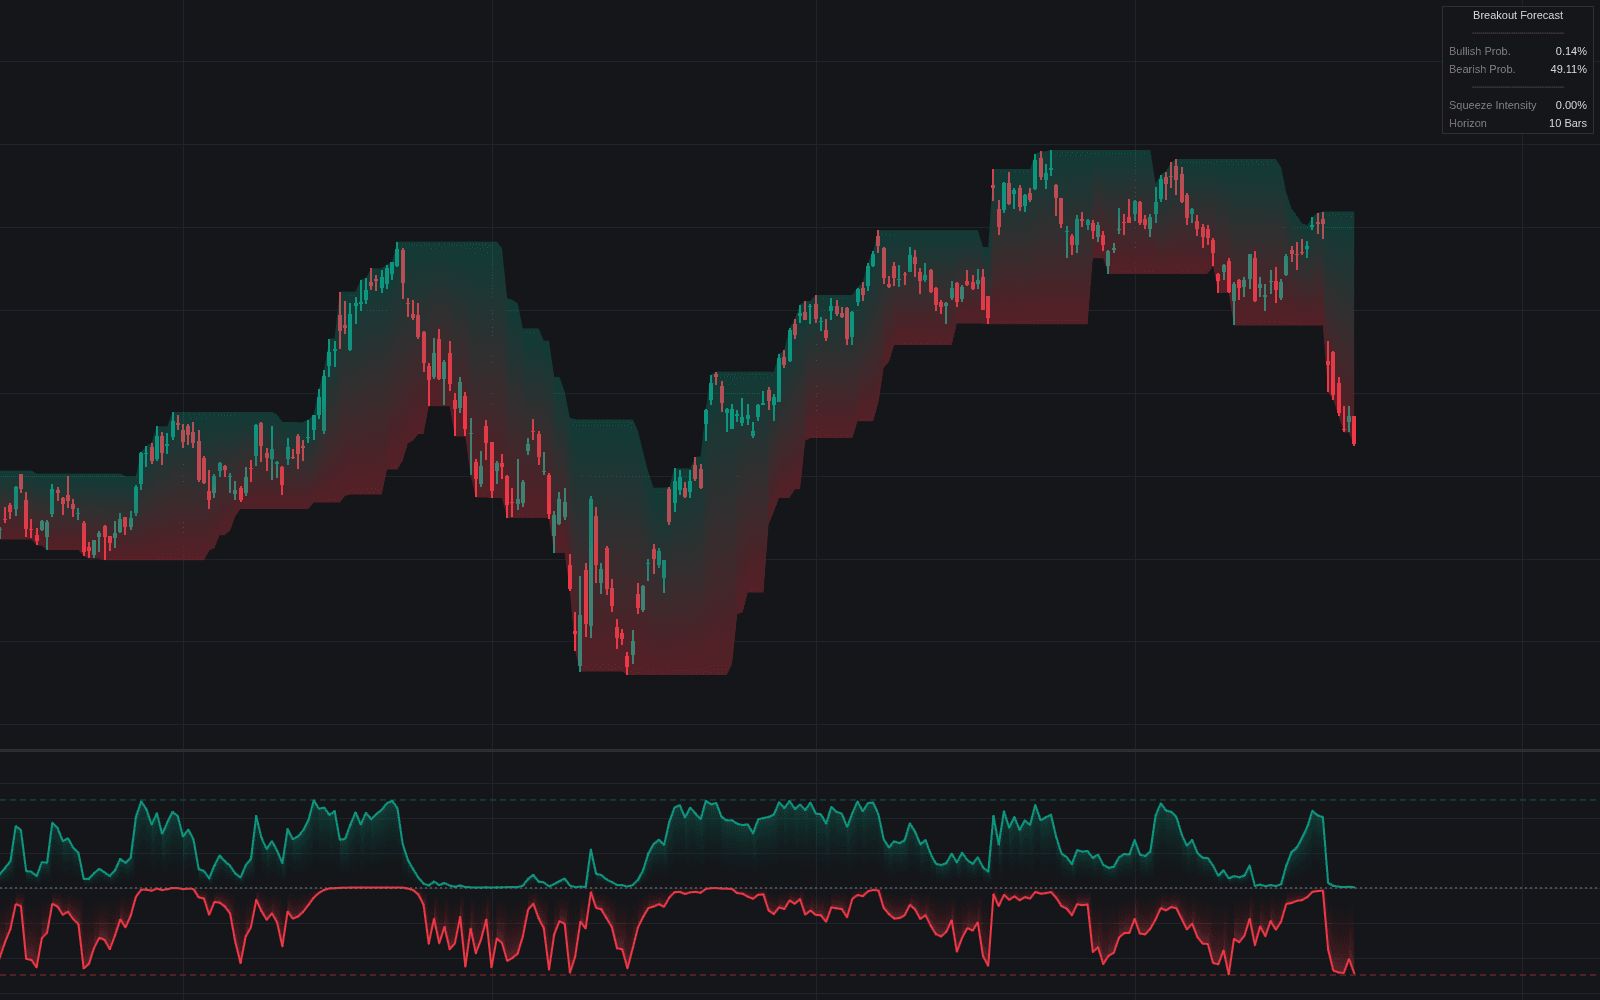
Candle Breakout Oscillator reads the market one close at a time, scoring how consistently candles finish beyond the previous bar's extremes. A close above the prior high or below the prior low counts as a breakout; a close inside the prior range counts as indecision. Three plots (bullish, bearish, and sideways) normalize those readings onto a 0–100 scale, so a glance shows which crowd controls the tape and how firmly.
How to Trade the Candle Breakout Oscillator?
- A plot above 80: near-maximum strength for that regime: bulls stacking closes above prior highs, bears breaking prior lows, or chop dominating the window.
- A plot below 20: that group has gone quiet, pronounced weakness in its behavior.
- Bullish/bearish crossovers: dominance changing hands between buyers and sellers, often before the momentum shift is obvious on price.
- Sideways plot crossing 80 or 20: the market slipping into, or breaking out of, a range-bound phase.
Values leaving an extreme are as informative as values reaching one: touching 80 flags trend maturity or potential exhaustion, while rolling back off it points to a possible reversal or consolidation phase. Volume or price-delta weighting can sharpen the raw readings on markets where participation matters.
Candle Breakout Oscillator Settings
- Window (default 100): candles included in the calculation.
- Smoothing Method (default RMA): ten moving averages, including RMA, TEMA, and HMA (Hull), or None to skip smoothing.
- Smoothing Length: responsiveness of the chosen filter.
- Weighting Method: None, Volume, or Price. Volume suits participation-sensitive markets, Price weights by movement intensity.
- Top Threshold (default 80): the strength line.
- Bottom Threshold (default 20): the weakness line.
Frequently Asked Questions
Free to use
Run it on Vela. Go further with a paid plan.
- Up to 500 strategy alerts, with webhook automation
- Up to 10× the chart history of Free
- Orderflow lookback up to full history
- More Quant usage to customize it, plus extra usage when you need it
- Futures data alongside crypto, stocks, forex and commodities
Also works on

Related indicators
All 29 Breakout indicators
Run it on Vela. Make it yours with Quant.
Open this indicator free on Vela, our next-generation charting platform. Then ask Quant, our coding agent built into Vela, to retune it or turn it into a backtested strategy of your own.