Concept
Momentum
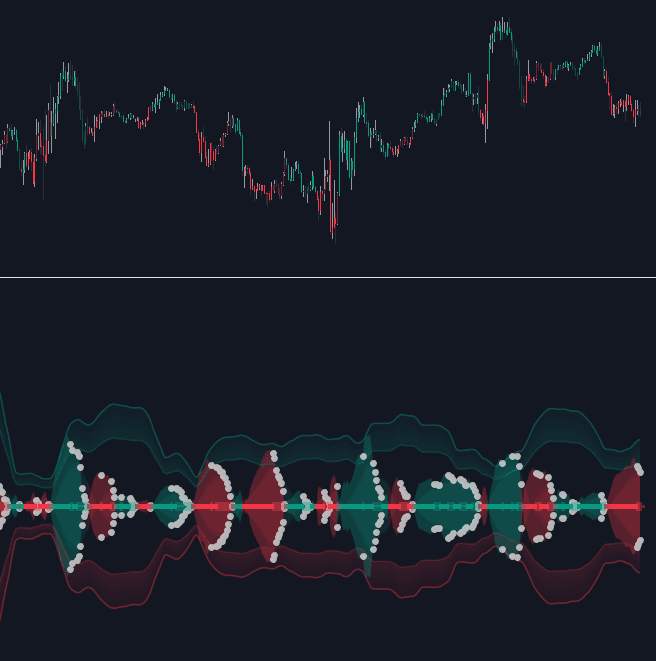
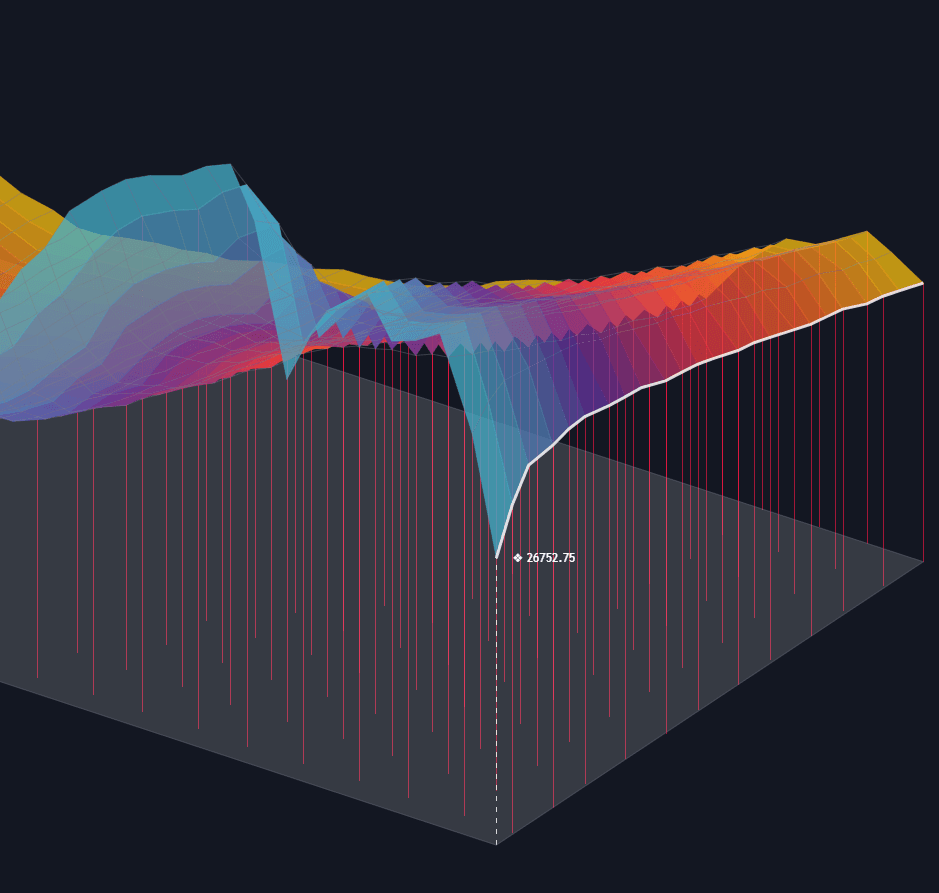
Momentum is a Momentum & Oscillators concept. The Library holds 6 implementations, each one a working definition you can pull into Quant.
raw
Top Momentum indicators
The top custom implementations, built on the original standard Momentum formula.
6 total
Any of the 6 Momentum implementations below can become a backtested trading strategy — describe your rules and Quant writes the code.
What is Momentum?
Momentum in technical analysis names two closely related things. As a property, it is the speed at which price is changing: how far the market travels per unit of time. As an indicator, it is one of the oldest and simplest oscillators: momentum equals the current close minus the close n bars ago, with 10 as the textbook lookback. The line oscillates around zero, positive whenever price is above where it stood n bars back, and it is unbounded and quoted in price units.
The physics analogy is standard: if price is position, momentum is velocity. That framing carries the classic argument for watching it: velocity often peaks before position does, so momentum frequently rolls over while price is still grinding toward its final extreme. This is an observed tendency and the basis of divergence analysis, not a law. The percentage version of the same measurement is ROC, which divides the change by the old price and so compares cleanly across instruments.
Momentum matters because it is the root of the oscillator family: RSI is built from smoothed one-bar price changes, MACD from the spread of two smoothed price averages, and stochastics restate the same underlying motion as position within the recent range. The word also names a broader research finding, the tendency of recent relative winners to keep outperforming over medium horizons, documented in academic finance as a historical regularity rather than a guarantee. Chart momentum and factor momentum share a premise but are measured very differently.
How to calculate Momentum
One subtraction defines the indicator; the only choices are the lookback and how the result is scaled.
- 1Choose the lookback n. Ten periods is the traditional default; shorter windows read faster and noisier, longer windows slower and smoother.
- 2Subtract: momentum equals the close minus the close n bars ago, a raw difference in price units. Some platforms instead plot the ratio of close to old close times 100, which centers at 100 rather than 0, so check which definition yours uses.
- 3Read sign and slope. Above zero means price is higher than n bars ago; a rising line means the advance is accelerating, while a falling line under a still-rising price means it is decelerating.
- 4Watch turns at extremes: momentum peaking and rolling over ahead of price is the raw form of divergence, and zero crosses mark where the n-bar change flips sign.
How it's calculated
Momentum is the raw change in price over the last n bars, in price units.
Rate of Change is the percentage form: ROC_t = 100 × (C_t - C_{t-n}) / C_{t-n}.
Some platforms plot the ratio form 100 × C_t / C_{t-n}, which oscillates around 100 instead of 0.
How traders use it
- As a minimal trend filter: above zero permits longs, below zero permits shorts. Crude but transparent, and it makes explicit what many trend rules reduce to, namely whether price is higher than it was n bars ago.
- As an acceleration gauge: slope changes flag thrust building or fading before price confirms, and taking the change of the change (ROC-of-ROC) reads that curvature directly.
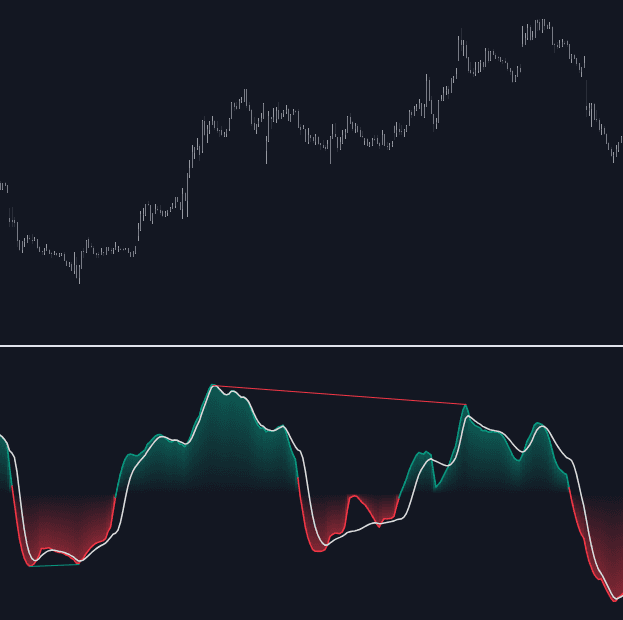
- For divergence at extremes: a new price high against a lower momentum peak is the original failing-thrust read, generally traded only with confirmation from price structure.
- As breakout confirmation: a breakout accompanied by expanding momentum is more convincing than one where the reading barely moves, the logic formalized in momentum thrust rules.
Momentum vs related measures
ROC: The same measurement expressed as a percentage of the old price. Zero crosses occur on the same bars and the two lines trace nearly identical shapes; only the scale differs. ROC is the version to use for cross-instrument comparison or across long histories at different price levels.
RSI: RSI transforms average gains and losses into a bounded 0-100 scale, so it reads stretch and supports fixed overbought/oversold lines. Raw momentum is unbounded: no level means the same thing across instruments or eras, so its extremes can only be judged relative to their own recent history.
MACD: MACD measures the spread between two EMAs, making it a smoothed, trend-referenced momentum with built-in signal logic. Raw momentum is a two-point difference: more immediate, much noisier, and with no smoothing baked in.
Chande Momentum Oscillator: CMO nets the sum of up-moves against the sum of down-moves over the window and scales the result to a fixed range from -100 to +100. It is momentum's bounded cousin, asking the same question in normalized units.
More Momentum implementations
Concept family
Momentum & Oscillators
91 concepts mapped · 91 in the Library
Momentum FAQ
Turn Momentum into a trading strategy.
Take any implementation from this page into Quant, then build on it, backtest it on real data, and keep refining it in conversation.