Chande Forecast Oscillator
 By LuxAlgoMar 5, 2026
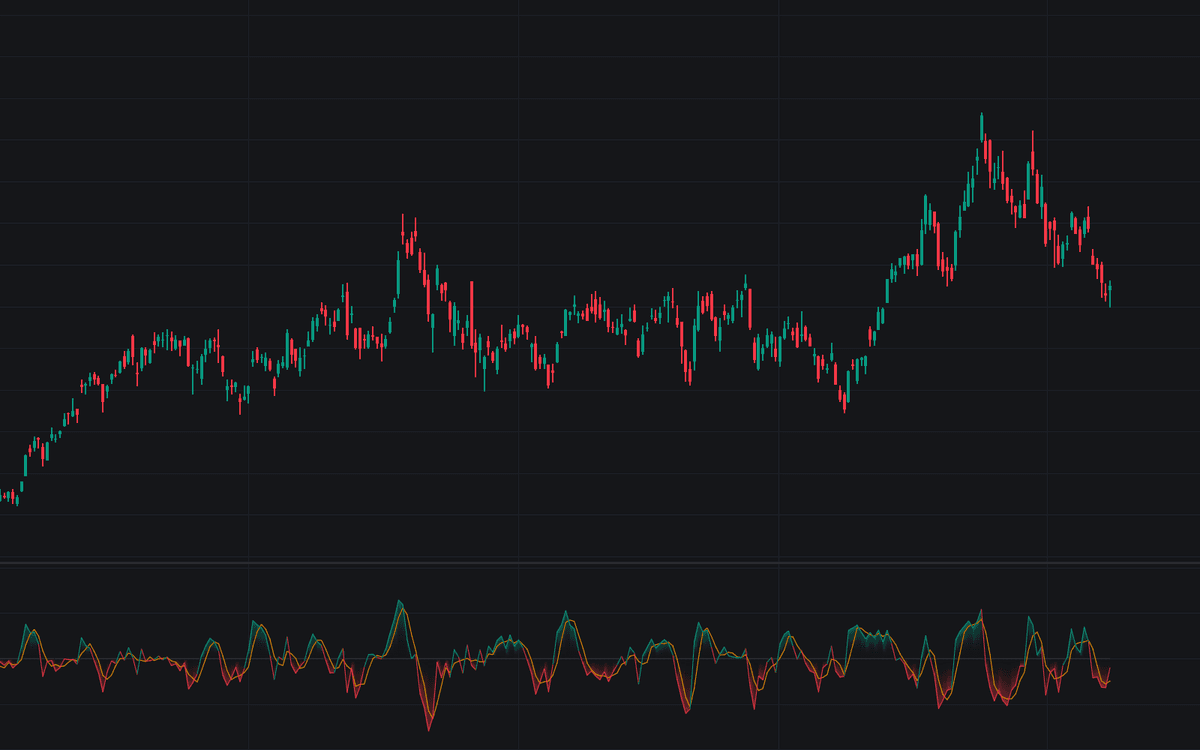

Chande Forecast Oscillator measures the distance between price and its own fitted trend: each bar a least-squares line is fit to the recent values, its endpoint is taken as the forecast for the current bar, and the oscillator is the gap between price and forecast as a percentage of price. This build renders Tushar Chande's forecast oscillator in its definitive clean form: the %F line colored by sign, a zero line, a trigger average, and a gradient fading toward zero.
How to Trade the Chande Forecast Oscillator?
- Zero cross up: the close moved above its regression forecast, short-term strength against the fitted trend.
- Zero cross down: the close dropped below the forecast, short-term weakness by the same logic.
- Trigger-line crosses: the oscillator crossing its own short average acts sooner than the zero cross and whips more often; both directions carry alerts.
- Stretch: the scale has no fixed bounds, so a large reading is judged against the instrument's own recent envelope, not universal levels.
In a steady trend the line hovers near zero (price simply meeting its own forecast), so persistent readings on one side mark acceleration or fatigue rather than direction alone.
Chande Forecast Oscillator Settings
- Source (default close): the series the regression is fit to; closes are the standard from the original %F formulation.
- Regression Length (default 14): bars in the least-squares window. Short windows hug price and cross zero often; long ones follow the broader trend and flag deviations more sparingly.
- Signal Smoothing (default 3, SMA): length and type (SMA or EMA) of the trigger average.
- Style: bullish and bearish colors, the signal-line color, Show Signal Line (default on), and Gradient Fill (default on).
Frequently Asked Questions

The Library is free. Quant makes it yours.
Pull any concept or indicator into Quant: rebuild it, retune it, or turn it into a backtested strategy of your own.