Chande Momentum Oscillator
 By LuxAlgoApr 13, 2020
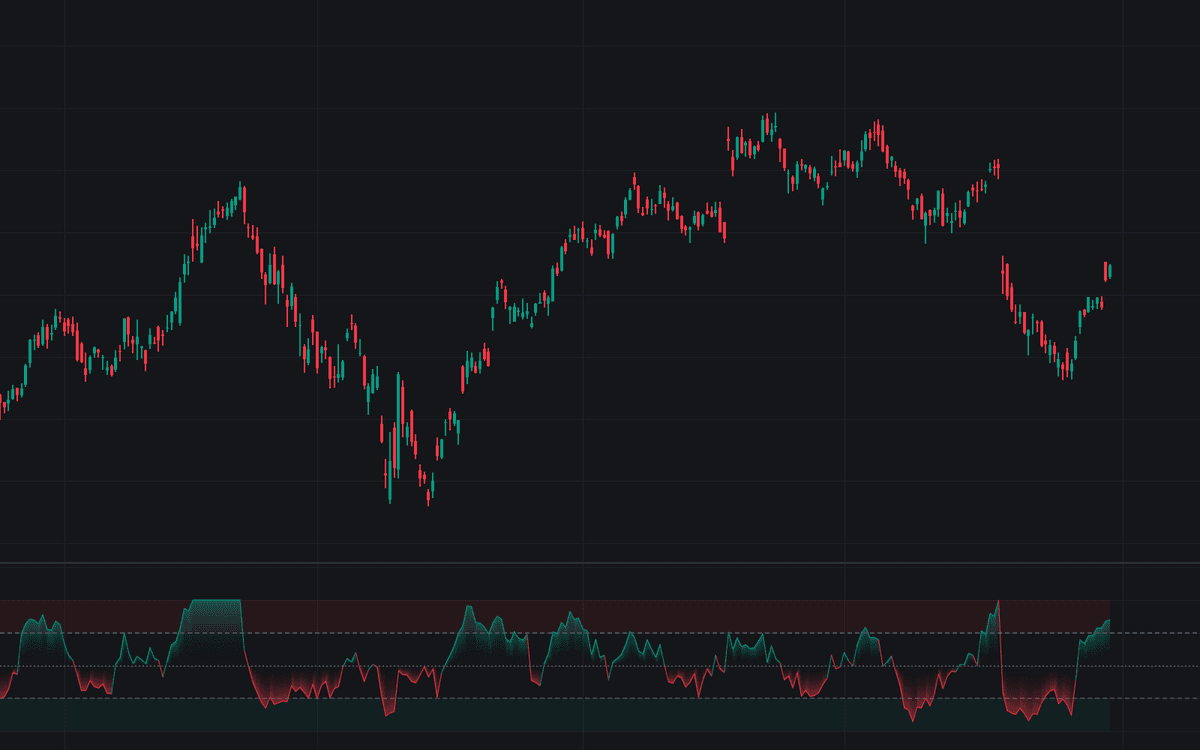

The Chande Momentum Oscillator measures how one-sided recent price movement has been. Over a lookback window it sums all gains and all losses separately, then expresses their difference as a share of total price movement, yielding an oscillator bounded between +100 and -100. The build is the standard implementation of Tushar Chande's formula with its usual default length of 9, plotted with overbought, oversold, and zero reference lines.
How to Trade the Chande Momentum Oscillator?
- CMO above the Overbought level (+50): heavily one-sided upside movement: stretch worth fading in ranges, simple persistence in strong trends, so context decides.
- CMO below the Oversold level (-50): the downside counterpart: sellers have dominated the window.
- Zero Line sign: above zero, up closes have outweighed down closes; below zero, the reverse, which makes a quick directional filter for other signals.
- Divergence: a new price extreme against a lesser CMO extreme shows the one-sidedness fading.
The raw sums make for a jagged line: the level the CMO holds across several bars carries more information than any single-bar spike.
Chande Momentum Oscillator Settings
- Length (default 9): the number of bars over which up moves and down moves are summed. Shorter windows reach the extremes constantly; longer ones visit them rarely but mark deeper stretch.
- Source (default close): the price series measured for bar-to-bar changes.
- Overbought Level (default 50): the threshold above which readings count as overbought.
- Oversold Level (default -50): the downside threshold, mirroring the overbought input.
Alerts
Three alert conditions are declared: Overbought Cross when the CMO crosses above the overbought level, Oversold Cross when it crosses below the oversold level, and Zero Cross when it crosses zero in either direction.
Frequently Asked Questions

The Library is free. Quant makes it yours.
Pull any concept or indicator into Quant: rebuild it, retune it, or turn it into a backtested strategy of your own.