Concept
Chande Forecast Oscillator
Chande Forecast Oscillator is a Momentum & Oscillators concept. The Library holds 1 implementation, a working definition you can pull into Quant.
Top Chande Forecast Oscillator indicator
The top custom implementation, built on the original standard Chande Forecast Oscillator formula.
1 total
The Chande Forecast Oscillator implementation below can become a backtested trading strategy — describe your rules and Quant writes the code.
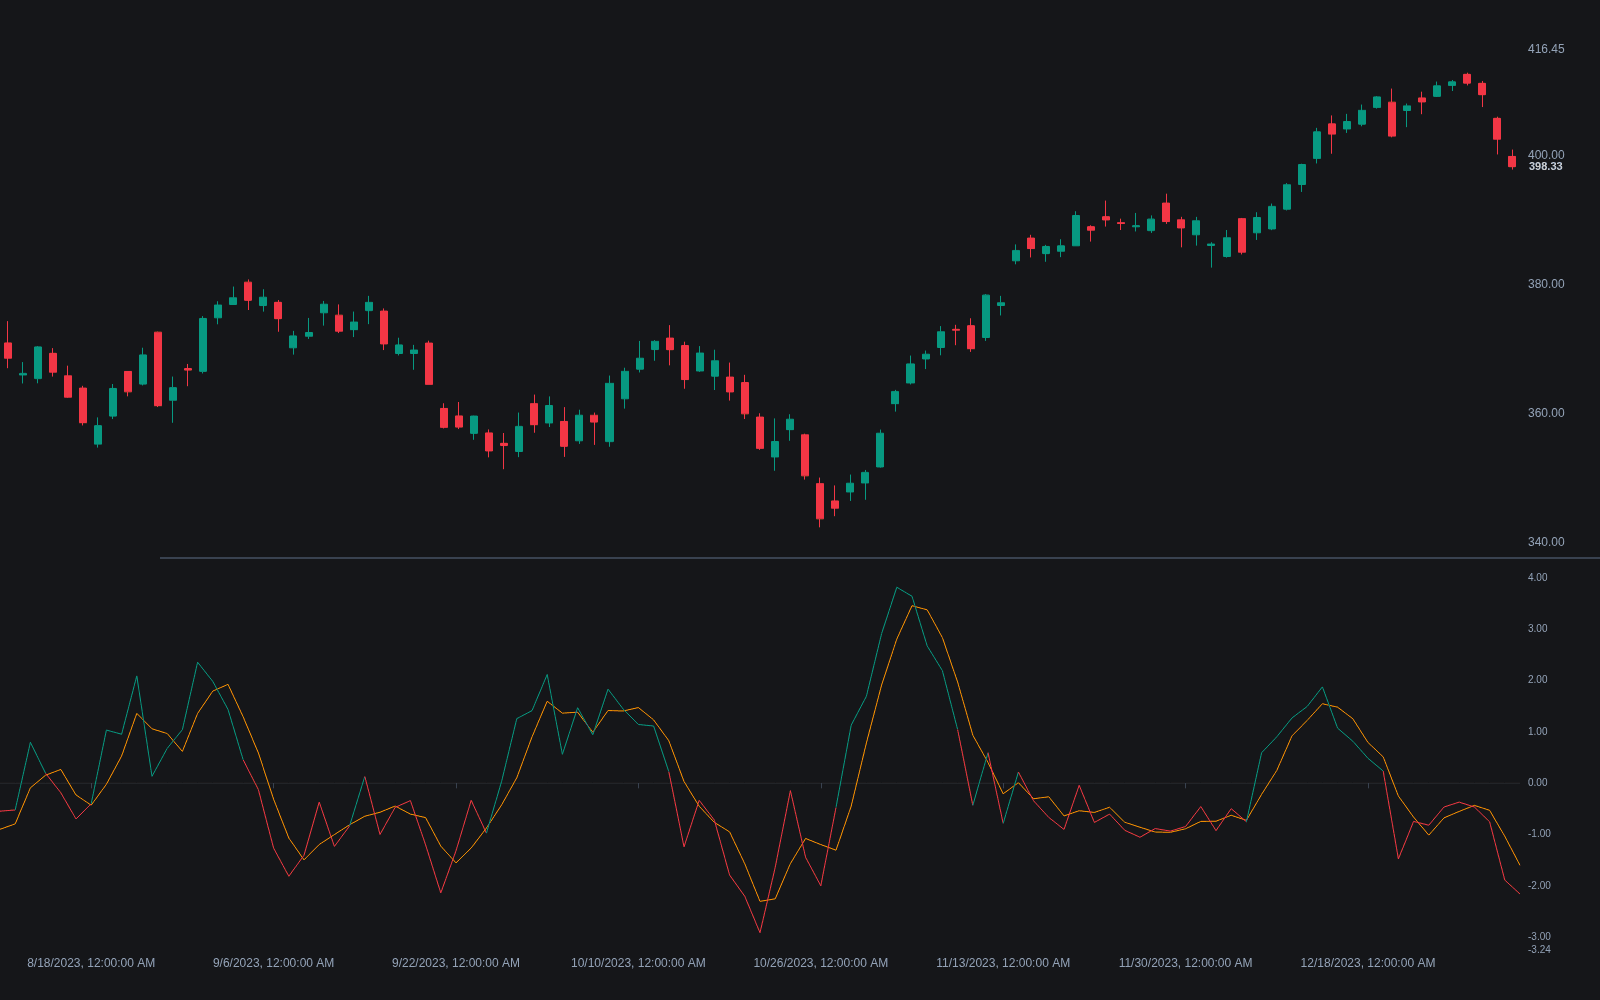
What is the Chande Forecast Oscillator?
The Chande Forecast Oscillator (CFO) measures how far price sits from where a linear regression says it should be. Each bar, a regression line is fit to the last n closes and its forecast value for the current bar is taken; the oscillator is the close minus that forecast, expressed as a percentage of the close. Positive readings mean price is running above its own fitted trend, negative readings mean it is running below.
Because the forecast comes from the end of a least-squares fit, closely related to the least-squares moving average, the oscillator behaves as a percentage deviation from the regression line: it crosses zero when price crosses the fit and stretches when a move outruns its own trend. A short moving average of the oscillator is often added as a trigger line.
Tushar Chande, the quantitative analyst also behind the Chande Momentum Oscillator, VIDYA, and the Aroon system, introduced it as %F in a 1992 Technical Analysis of Stocks & Commodities article on forecasting the next trading day from a linear regression. The appeal over classical momentum measures: differencing today's close against a single close n bars ago leaves the reading hostage to whatever that one old bar happened to be. A regression forecast instead uses every bar in the window and asks a cleaner question: is price ahead of or behind its own trend?
That anchor changes the behavior. In a steady, straight-line trend, ROC stays persistently positive while the CFO hovers near zero, because price is simply meeting its own forecast; the CFO only stretches when a move accelerates beyond its fitted pace or breaks down below it. It is expressed as a percentage of price, so readings are comparable across instruments, but it has no fixed bounds, meaning overbought/oversold judgments must be made against the instrument's own recent envelope rather than universal levels.
How to identify Chande Forecast Oscillator signals on a chart
The CFO plots in its own panel around a zero line, usually with a short moving average as a trigger.
- 1Note the typical envelope first: scan back and see what a normal reading is for this instrument and timeframe, since the percentage scale has no fixed extremes.
- 2Read the zero line as fit versus price: above zero, the close is running ahead of its regression forecast; below, behind it.
- 3Mark stretch extremes relative to that envelope; they flag price outrunning its own fit in either direction.
- 4Watch swing disagreement: price printing a new high while the CFO prints a lower high means the latest push no longer exceeds its forecast, a regular divergence-style caution.
How it's calculated
Expresses how far the close sits above or below its n period linear regression forecast, as a percent of price.
Introduced by Tushar Chande; positive readings mean price is above its regression fit, negative below, and zero crossings mark price crossing the fit.
Some platforms use the one bar ahead Time Series Forecast instead, F_t = a_t + b_t × n, which shifts readings slightly.
A short signal EMA of CFO, commonly 3 bars, is often drawn as a trigger line.
How traders use it
- Zero-line crossings as short-term trend cues: turning positive is read as strength against the fitted trend and turning negative as weakness, with the caveat that flat markets produce constant whipsaw around zero unless a trend filter is added.
- Stretch readings as mean-reversion context: values that are large relative to the instrument's own recent history flag price extended from its regression fit, a condition that can resolve by pullback or by the trend simply re-accelerating.
- Trigger-line crossings for earlier signals: the oscillator crossing its own smoothed version typically fires before the zero cross does, at the cost of more noise.
- Gated by a slower regime tool: pairing CFO zero crosses with a broader filter such as the MACD regime or a long moving average keeps the fast signal from firing against the dominant trend.
- Cross-checked against gain/loss oscillators: because the CFO measures deviation from a fitted line while RSI measures the balance of gains and losses, traders read agreement between the two as stronger evidence than either alone.
Chande Forecast Oscillator vs related measures
ROC: ROC compares the close with a single close n bars ago, so a steady trend keeps it pinned positive or negative. The CFO compares the close with a regression forecast built from every bar in the window, so a steady trend reads near zero and only acceleration or breakdown moves it.
Disparity Index: The disparity index is the percentage gap between the close and a moving average, structurally the CFO's closest cousin. A moving average lags inside trends, so disparity stretches merely because a trend exists; the regression endpoint tracks the trend, so CFO stretch isolates deviation from it.
Momentum: Raw momentum is the unbounded point difference between today's close and an older one, unnormalized, so readings are not comparable across instruments or eras. The CFO is expressed as a percentage of price and anchored to a fit rather than a single reference bar.
Concept family
Momentum & Oscillators
91 concepts mapped · 91 in the Library
Chande Forecast Oscillator FAQ
Turn Chande Forecast Oscillator into a trading strategy.
Take the implementation from this page into Quant, then build on it, backtest it on real data, and keep refining it in conversation.