


Change-Point Detection (CUSUM)
 by LuxAlgo · Feb 17, 2026
The Change-Point Detection (CUSUM) indicator is a quantitative trading indicator designed to detect structural shifts in market regimes using a modified Cumulative Sum (CUSUM) algorithm. Instead of relying on lagging moving averages, this strategy identifies statistically significant deviations in price behavior, allowing traders to spot bullish-to-bearish (and vice versa) transitions early—often before traditional trend indicators react.
By continuously accumulating standardized price deviations, the indicator highlights regime changes as soon as the market reaches a measurable tipping point. This makes it especially useful for traders seeking systematic trend detection, volatility regime identification, and objective trading signals based on statistical thresholds.
How to Trade the Change-Point Detection (CUSUM) Indicator?
The CUSUM trading indicator is built to help traders identify when a market transitions from one structural state to another. Rather than asking, “Is the trend up or down?”, it asks, “Has the statistical behavior of price changed?”
The core concept is simple: when price deviates significantly and persistently from its recent norm, the probability of a regime shift increases.
This makes the indicator suitable for:
- Trend-following strategies
- Regime-based portfolio allocation
- Volatility expansion detection
- Systematic trading strategies
- Algorithmic and discretionary trading workflows
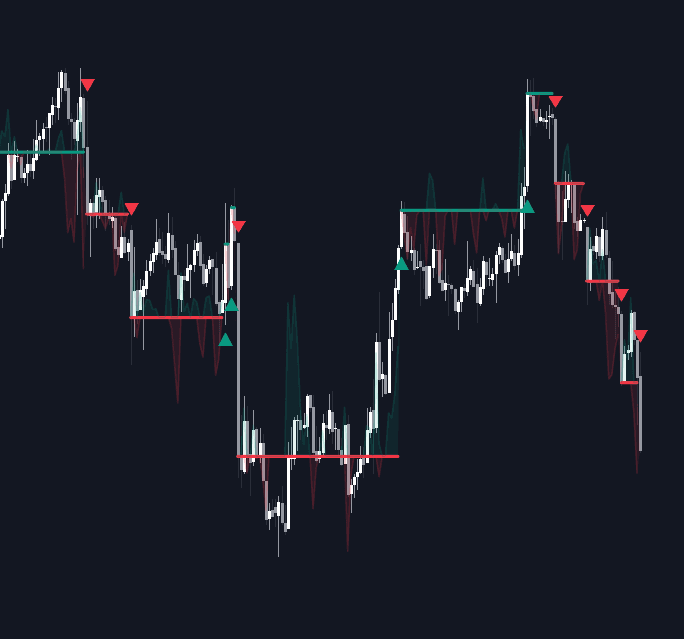
Interpreting the Visual Signals
The visual components are designed to clearly show regime structure and pressure buildup.
-
Regime Line:
A solid horizontal or stepping line marks the price at which the last confirmed change-point occurred.- Green indicates a bullish regime.
- Red indicates a bearish regime.
This line serves as the structural baseline for the current market state.
-
Pressure Bands (sPos & sNeg):
Shaded areas extending from the regime line represent the cumulative pressure building against the current regime.- sPos accumulates upward pressure.
- sNeg accumulates downward pressure.
When pressure builds steadily, it suggests growing instability in the current regime.
-
Change-Point Markers:
Small triangles appear when cumulative pressure exceeds the predefined statistical threshold.
At this point:- A new regime is confirmed.
- Accumulators reset.
- A new baseline price is established.
This structure allows traders to visually track market stability versus regime stress in real time.
Strategy Logic Behind the CUSUM Trading Indicator
The Change-Point Detection indicator uses a modified version of the CUSUM algorithm—a sequential statistical technique commonly used in quality control and signal processing to detect structural changes.
Here’s how it works step-by-step:
1. Log-Returns & Standardization
Instead of using raw price changes, the script calculates log-returns. These returns are then standardized using a rolling mean and standard deviation to generate a Z-Score.
Why this matters:
- Keeps the algorithm volatility-adjusted.
- Makes the indicator adaptive across assets (stocks, forex, crypto, futures).
- Prevents price scale from affecting sensitivity.
This ensures the trading indicator behaves consistently whether you're analyzing BTCUSD, SPY, or EURUSD.
2. Dual Accumulation Process
Two accumulators track statistical pressure:
- sPos: Tracks positive deviations.
- sNeg: Tracks negative deviations.
Only meaningful deviations contribute to accumulation, filtering out random noise.
3. The Slack Parameter (k)
The slack parameter k defines the minimum deviation required before accumulation begins.
- Higher k = more filtering = fewer but stronger signals.
- Lower k = more sensitive = faster regime detection.
This acts as a noise suppression filter and helps reduce false signals in sideways markets.
4. The Threshold Parameter (h)
The threshold h defines when a regime change is confirmed.
When either accumulator exceeds h:
- A structural shift is confirmed.
- Accumulators reset.
- The regime line updates.
Higher thresholds favor long-term structural shifts.
Lower thresholds detect shorter-term regime rotations.
Practical Trading Applications
The CUSUM trading strategy can be integrated into multiple workflows:
- Trend Confirmation: Enter in the direction of newly detected regimes.
- Risk Management: Reduce exposure when pressure builds against the current regime.
- Volatility Breakouts: Use change-points to anticipate expansion phases.
- Strategy Switching: Automatically toggle between mean-reversion and trend-following systems based on regime state.
Because the indicator is statistically grounded, it provides an objective framework rather than relying on subjective pattern recognition.
Indicator Settings Explained
Algorithm Settings
-
Lookback Period:
Defines the rolling window used to compute mean and standard deviation.
Shorter values increase responsiveness.
Longer values stabilize detection. -
Threshold (h):
Controls detection sensitivity.
Higher values require stronger, sustained pressure to confirm regime changes. -
Slack (k):
Filters minor fluctuations.
Increasing slack reduces noise and prevents premature triggers.
Optimizing these parameters allows traders to adapt the indicator to scalping, swing trading, or longer-term position trading strategies.
Dashboard Controls
-
Enable Dashboard:
Displays real-time information about regime state and parameters. -
Position:
Allows placement in different corners of the chart. -
Size:
Adjusts the visual scale for clarity across timeframes and screen sizes.
Why Use CUSUM for Trading?
Traditional trading indicators often lag because they smooth price using averages. The Change-Point Detection (CUSUM) indicator instead measures cumulative statistical imbalance, which allows it to:
- Detect structural shifts early
- Adapt to volatility changes
- Provide regime-aware signals
- Reduce dependence on subjective trendlines
- Work across asset classes and timeframes
This makes it particularly valuable for systematic traders, quant-driven strategies, and advanced technical analysis.
FAQ
What is the Change-Point Detection (CUSUM) indicator used for?
It is a statistical trading indicator designed to detect structural market regime shifts by accumulating standardized deviations in price returns. It helps traders identify when a trend has statistically changed rather than relying on lagging averages.
Is this a trend-following or mean-reversion indicator?
Primarily, it is a regime detection tool. It can be used to support both trend-following and mean-reversion strategies depending on how traders interpret regime shifts.
Does the indicator repaint?
No. Change-points are confirmed only when the statistical threshold is exceeded, and once confirmed, the regime baseline resets without repainting past signals.
How do I access the Change-Point Detection (CUSUM) indicator?
You can get access on the LuxAlgo Library for charting platforms like TradingView, MetaTrader (MT4/MT5), and NinjaTrader for free.
Trading & investing are risky and many will lose money in connection with trading and investing activities. All content on this site is not intended to, and should not be, construed as financial advice. Decisions to buy, sell, hold or trade in securities, commodities and other investments involve risk and are best made based on the advice of qualified financial professionals. Past performance does not guarantee future results.
Hypothetical or Simulated performance results have certain limitations. Unlike an actual performance record, simulated results do not represent actual trading. Also, since the trades have not been executed, the results may have under-or-over compensated for the impact, if any, of certain market factors, including, but not limited to, lack of liquidity. Simulated trading programs in general are designed with the benefit of hindsight, and are based on historical information. No representation is being made that any account will or is likely to achieve profit or losses similar to those shown.
Testimonials appearing on this website may not be representative of other clients or customers and is not a guarantee of future performance or success.
As a provider of technical analysis tools and strategies, we do not have access to the personal trading accounts or brokerage statements of our customers. As a result, we have no reason to believe our customers perform better or worse than traders as a whole based on any content, tool, or platform feature we provide.
Charts used on this site are by TradingView in which the majority of our technical indicators are built on. TradingView® is a registered trademark of TradingView, Inc. www.TradingView.com TradingView® has no affiliation with the owner, developer, or provider of the Services described herein.
Market data is provided by CBOE, CME Group, BarChart, Massive, CoinAPI. Select U.S. equities data is provided through Massive. CBOE BZX real-time U.S. equities data is licensed from CBOE and provided through BarChart. Real-time futures data is licensed from CME Group and provided through BarChart. Select cryptocurrency data, including major coins, is provided through CoinAPI. All data is provided “as is” and should be verified independently for trading purposes.
This does not represent our full Disclaimer. Please read our full disclaimer.
© 2026 LuxAlgo Global, LLC.