


Crypto PCA
 by LuxAlgo · Feb 5, 2026
The Crypto PCA [LuxAlgo] indicator is a professional-grade trading indicator designed to measure crypto market sentiment at a macro level using a quantitative, multi-asset approach. By applying Principal Component Analysis (PCA) to a basket of the top 20 cryptocurrencies, this tool condenses broad market behavior into a single oscillator that reflects the dominant trend and collective momentum of the crypto market.
Instead of focusing on individual coins in isolation, this trading indicator filters out idiosyncratic noise and highlights the underlying force driving the entire sector. It effectively transforms Bitcoin, Ethereum, Solana, and 17 other major cryptocurrencies into one cohesive signal, making it an ideal companion for traders looking to align their trading strategy with overall market conditions.
In institutional quantitative finance, PCA is commonly used to reduce dimensionality and uncover hidden factors influencing groups of correlated assets. The Crypto PCA indicator brings this same institutional methodology to retail traders in a clear, visual, and actionable format.
How to Trade the Crypto PCA Trading Indicator?
This indicator functions as a macro sentiment oscillator, helping traders identify when the crypto market is moving collectively and when that collective move becomes statistically extreme. It is particularly useful for market regime detection, risk-on vs risk-off analysis, and contextual confirmation for individual trade setups.
Identifying Crypto Market Regimes
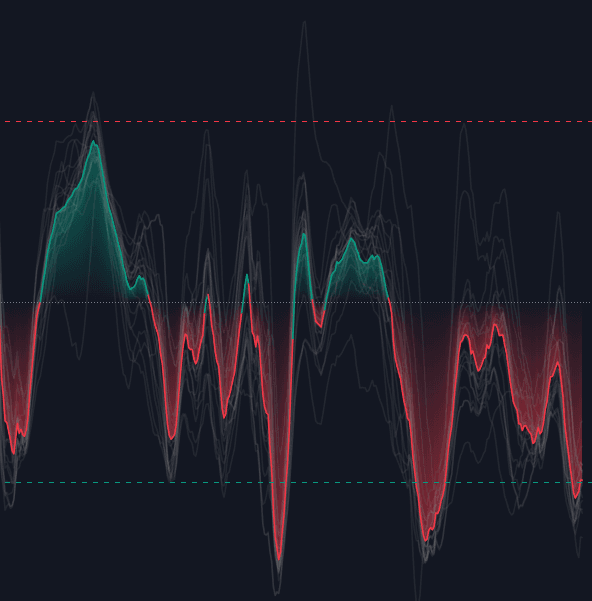
The primary PCA output (PC1) represents the dominant factor driving price variance across the top 20 cryptocurrencies.
- When the PCA line is above zero and green, the majority of assets are experiencing positive variance, signaling a broad bullish market regime.
- When the PCA line is below zero and red, the market is in a collective bearish regime, with negative variance dominating.
Traders can use this information to align long or short trading strategies with the prevailing crypto market environment rather than trading against the dominant flow.
Using Snapshot Mode for Market Context
While the default continuous mode is well-suited for trend following and macro analysis, Snapshot Mode provides a focused view of the most recent sentiment cycle.
Snapshot Mode isolates the PCA calculation to the latest lookback window, removing the influence of older historical data. This allows traders to analyze the internal structure and trajectory of the most recent market move.
This mode is especially useful for determining whether a sudden pump or dump is:
- A coordinated, market-wide event driven by collective sentiment, or
- A fragmented move driven by isolated volatility in specific assets
This distinction helps traders differentiate between genuine structural shifts and short-term noise.
Spotting Overbought and Oversold Conditions
The indicator includes dashed horizontal levels at +2 and -2, representing standard deviation thresholds.
Because all assets are standardized before calculation, these levels highlight statistically significant extremes in market sentiment.
- Overbought Market Conditions: When the PCA line rises above +2, the crypto market is broadly overextended. This often precedes cooling phases, consolidation, or mean reversion across the sector.
- Oversold Market Conditions: When the PCA line falls below -2, it reflects widespread panic or exhaustion selling, which can signal potential bottoms or relief rallies.
These levels are best used for contextual awareness rather than precise timing.
Gauging Relative Strength Across Cryptocurrencies
The faint background “ghost” lines represent the individual standardized price paths of each asset in the basket.
By comparing these to the main PCA line:
- Assets consistently above the PCA line during bullish phases are showing relative strength
- Assets consistently below the PCA line are underperforming the market average
This allows traders to identify potential leaders and laggards while staying aligned with overall market sentiment.
Indicator Details and Methodology
The Crypto PCA indicator follows a statistically rigorous process to ensure meaningful comparisons across assets with vastly different price levels and volatility profiles.
Z-Score Standardization
Before PCA is applied, all asset prices are converted into Z-scores using the selected lookback period.
Z-score standardization measures how many standard deviations a price is from its mean. This step ensures that high-priced assets like Bitcoin can be directly compared to lower-priced assets without distortion, making the PCA calculation statistically valid.
Crypto Basket and PCA Approximation
The indicator includes the following 20 cryptocurrencies:
BTC, ETH, BNB, XRP, SOL, TRX, DOGE, ADA, BCH, WBTC, XLM, LTC, HBAR, LINK, AVAX, PEPE, DOT, UNI, NEAR, and ICP.
Rather than performing a full matrix decomposition, the script uses a correlation-based PCA approximation. Each asset’s correlation to an equally weighted basket is used as its loading in the first principal component.
Assets that move more in sync with the overall crypto market naturally receive greater influence in the final oscillator, ensuring that PC1 truly represents market-wide behavior.
Why Use PCA Instead of a Crypto Index?
Most crypto indices are simple weighted averages. PCA goes a step further by identifying commonality between assets.
If most coins are moving together while a few diverge, PCA emphasizes the dominant collective movement rather than averaging everything equally. This makes it a more accurate representation of underlying market sentiment and energy.
Settings
Main Settings
- Lookback Period (N): Defines the window used for Z-score standardization and PCA calculations. Shorter values increase responsiveness, while longer values highlight macro sentiment cycles.
- Z-Score Smoothing: Applies an SMA to standardized asset values before PCA calculation, reducing high-frequency noise and limiting false regime shifts.
- Enable Snapshot Mode: Switches the display from a rolling PCA line to a fixed view of the most recent sentiment window.
Visual Settings
- Standardized Assets Color: Adjusts the color and transparency of individual asset lines.
- Bull/Bear Colors: Customizes colors for positive and negative market sentiment.
Disclaimer: This trading indicator is a statistical sentiment analysis tool and does not constitute financial advice. PCA measures variance and correlation, not guaranteed future price direction.
FAQ
What is the Crypto PCA indicator used for?
The Crypto PCA indicator is used to measure broad crypto market sentiment, identify bullish and bearish regimes, and detect statistically overextended conditions across the entire sector.
Is this indicator suitable for all trading strategies?
Yes. It works well as a confirmation tool for discretionary trading, swing trading, and systematic trading strategies by providing macro-level context.
How can I access the Crypto PCA [LuxAlgo] indicator?
You can get access on the LuxAlgo Library for charting platforms like TradingView, MetaTrader (MT4/MT5), and NinjaTrader for free.
Unlock Unlimited Access to the LuxAlgo Library
Upgrade your plan to get all indicators, strategies, charts, and full access to Quant, our AI agent.
Trading & investing are risky and many will lose money in connection with trading and investing activities. All content on this site is not intended to, and should not be, construed as financial advice. Decisions to buy, sell, hold or trade in securities, commodities and other investments involve risk and are best made based on the advice of qualified financial professionals. Past performance does not guarantee future results.
Hypothetical or Simulated performance results have certain limitations. Unlike an actual performance record, simulated results do not represent actual trading. Also, since the trades have not been executed, the results may have under-or-over compensated for the impact, if any, of certain market factors, including, but not limited to, lack of liquidity. Simulated trading programs in general are designed with the benefit of hindsight, and are based on historical information. No representation is being made that any account will or is likely to achieve profit or losses similar to those shown.
Testimonials appearing on this website may not be representative of other clients or customers and is not a guarantee of future performance or success.
As a provider of technical analysis tools and strategies, we do not have access to the personal trading accounts or brokerage statements of our customers. As a result, we have no reason to believe our customers perform better or worse than traders as a whole based on any content, tool, or platform feature we provide.
Charts used on this site are by TradingView in which the majority of our technical indicators are built on. TradingView® is a registered trademark of TradingView, Inc. www.TradingView.com TradingView® has no affiliation with the owner, developer, or provider of the Services described herein.
Market data is provided by CBOE, CME Group, BarChart, Massive, CoinAPI. Select U.S. equities data is provided through Massive. CBOE BZX real-time U.S. equities data is licensed from CBOE and provided through BarChart. Real-time futures data is licensed from CME Group and provided through BarChart. Select cryptocurrency data, including major coins, is provided through CoinAPI. All data is provided “as is” and should be verified independently for trading purposes.
This does not represent our full Disclaimer. Please read our full disclaimer.
© 2026 LuxAlgo Global, LLC.