


Cycle Spectrogram
Feb 15, 2026
The Cycle Spectrogram indicator is an advanced trading indicator designed to uncover hidden market cycles and dominant price rhythms using spectral analysis. By transforming raw price data into a dynamic heatmap of cycle power, this tool helps traders identify whether current market conditions are driven by short-term volatility or longer-term structural trends. Instead of relying solely on traditional momentum or trend indicators, the Cycle Spectrogram provides a data-driven view of periodic behavior—making it a powerful addition to any systematic trading strategy.
How to Trade with the Cycle Spectrogram Indicator
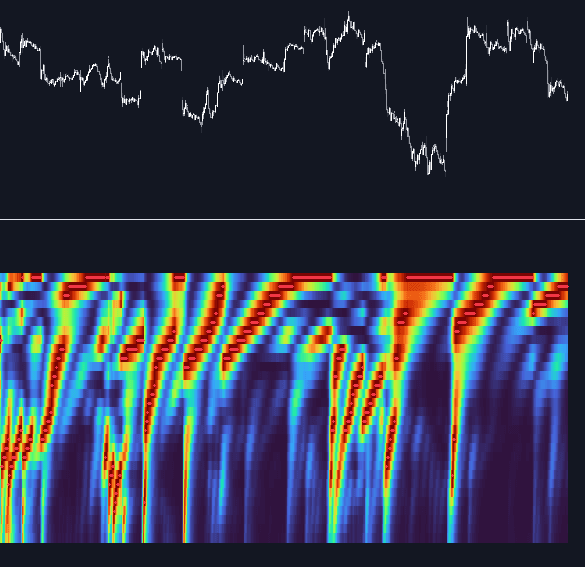
This trading indicator visualizes spectral density in real time by decomposing price action into multiple cycle bands. The result is a spectrogram—a heatmap that shows which cycle lengths are currently dominant and how they evolve over time.
By monitoring changes in cycle energy, traders can:
- Adapt their trading strategy to prevailing market rhythms
- Identify transitions from trending to ranging environments
- Detect early shifts in dominant time horizons
- Align entries and exits with statistically significant cycles
When shorter cycles dominate, the market may favor scalping or mean-reversion strategies. When longer cycles gain strength, swing trading and trend-following approaches tend to perform better.
Spectrogram Interpretation
The spectrogram consists of 30 horizontal rows, each representing a specific cycle period. The vertical axis is logarithmically scaled between the Minimum Period and Maximum Period settings, ensuring balanced coverage across short and long cycles.
Key components:
- Color Intensity: Brighter or more saturated colors (depending on the selected theme) indicate higher spectral power or “energy” at that cycle length. Strong energy suggests that price is oscillating consistently at that periodicity.
- Vertical Position:
- Lower rows = Shorter cycles (fast market oscillations, intraday noise)
- Higher rows = Longer cycles (macro swings, structural trends)
If energy clusters in the lower bands, the market is dominated by fast, reactive behavior. If the upper bands light up, broader structural cycles are driving price action.
Dominant Period Tracking
To simplify interpretation, the indicator includes a Dominant Period Marker (red cross). This marker automatically tracks the row with the highest spectral energy at each bar.
This provides:
- A real-time estimate of the strongest active market cycle
- A dynamic reference for timing-based strategies
- A quantitative way to measure cycle expansion or contraction
For example, if the dominant period gradually increases, the market may be transitioning into a slower, more stable trend phase.
Dashboard Metrics for Cycle-Based Trading
The built-in dashboard delivers key analytical metrics to support cycle-based decision-making:
- Current DP: The dominant cycle length (in bars) at the current moment.
- Average DP: A 20-period moving average of the dominant period, useful for identifying stable, persistent cycles versus erratic shifts.
- Lowest Period: The minimum spectral boundary defined in the settings.
Traders can use the relationship between Current DP and Average DP to gauge whether the market rhythm is accelerating or stabilizing.
Spectral Analysis Explained for Traders
A spectrogram is a visual representation of how the frequency spectrum of a signal evolves over time. In financial markets, this means identifying recurring price cycles hidden within seemingly random movements.
This script utilizes a series of Bandpass filters, each tuned to a specific cycle length. These cycle lengths are distributed logarithmically to ensure that:
- Short-term scalping cycles
- Medium-term swing cycles
- Long-term structural cycles
are all represented without bias toward a single timeframe.
The “Power” of each cycle is computed by:
- Passing price data through a bandpass filter
- Squaring the filtered output to measure energy
- Applying smoothing to reduce transient spikes
This creates a clean heatmap signature that highlights persistent market rhythms rather than temporary fluctuations.
Indicator Settings and Customization
The Cycle Spectrogram trading indicator is fully customizable to match different markets, timeframes, and trading styles.
Aesthetics
- Theme: Choose from high-contrast color maps such as Viridis, Inferno, Magma, Plasma, Cividis, and Turbo. These optimized visual palettes enhance readability and make dominant cycles stand out clearly.
Spectral Configuration
- Minimum Period: Defines the shortest cycle (in bars) included in the analysis. Lower values increase sensitivity to fast market fluctuations.
- Maximum Period: Defines the longest cycle considered. Increasing this captures broader market structure and macro rhythms.
- Bandwidth: Controls how tightly each bandpass filter isolates a cycle.
- Lower values = More precise cycle detection
- Higher values = Broader resonance and smoother transitions
- Power Smoothing: Determines how much smoothing is applied to cycle amplitude.
- Higher values reduce noise
- Lower values increase responsiveness
Dashboard Controls
- Dashboard: Enable or disable the real-time data panel.
- Position: Move the dashboard to different corners of the pane.
- Size: Adjust text and cell size for optimal visibility.
Why Use the Cycle Spectrogram in Your Trading Strategy?
Unlike traditional indicators that measure only momentum or trend direction, the Cycle Spectrogram focuses on market rhythm and periodic structure. This makes it especially useful for:
- Identifying regime shifts
- Timing entries based on dominant cycle length
- Optimizing lookback parameters for other indicators
- Enhancing systematic and quantitative trading models
By integrating spectral analysis into your trading workflow, you gain a structural perspective on price behavior that complements trend, volatility, and volume-based tools.
FAQ
What is the Cycle Spectrogram indicator used for?
It is a spectral analysis trading indicator used to identify dominant market cycles, periodicities, and rhythm shifts in price action.
Does the indicator repaint?
The cycle power visualization updates dynamically as new data arrives, reflecting real-time spectral conditions.
How can I incorporate it into a trading strategy?
Traders often align their strategy timeframe and indicator settings with the current dominant period. For example, when longer cycles dominate, trend-following strategies may be favored.
How do I access the Cycle Spectrogram indicator?
You can get access on the LuxAlgo Library for charting platforms like TradingView, MetaTrader (MT4/MT5), and NinjaTrader for free.
Trading & investing are risky and many will lose money in connection with trading and investing activities. All content on this site is not intended to, and should not be, construed as financial advice. Decisions to buy, sell, hold or trade in securities, commodities and other investments involve risk and are best made based on the advice of qualified financial professionals. Past performance does not guarantee future results.
Hypothetical or Simulated performance results have certain limitations. Unlike an actual performance record, simulated results do not represent actual trading. Also, since the trades have not been executed, the results may have under-or-over compensated for the impact, if any, of certain market factors, including, but not limited to, lack of liquidity. Simulated trading programs in general are designed with the benefit of hindsight, and are based on historical information. No representation is being made that any account will or is likely to achieve profit or losses similar to those shown.
Testimonials appearing on this website may not be representative of other clients or customers and is not a guarantee of future performance or success.
As a provider of technical analysis tools and strategies, we do not have access to the personal trading accounts or brokerage statements of our customers. As a result, we have no reason to believe our customers perform better or worse than traders as a whole based on any content, tool, or platform feature we provide.
Charts used on this site are by TradingView in which the majority of our technical indicators are built on. TradingView® is a registered trademark of TradingView, Inc. www.TradingView.comTradingView® has no affiliation with the owner, developer, or provider of the Services described herein.
Market data is provided by CBOE, CME Group, BarChart, CoinAPI. CBOE BZX real-time US equities data is licensed from CBOE and provided through BarChart. Real-time futures data is licensed from CME Group and provided through BarChart. Select cryptocurrency data, including major coins, is provided through CoinAPI. All data is provided “as is” and should be verified independently for trading purposes.
This does not represent our full Disclaimer. Please read our full disclaimer.
© 2026 LuxAlgo Global, LLC.