Demand Index
 By LuxAlgoJul 1, 2026
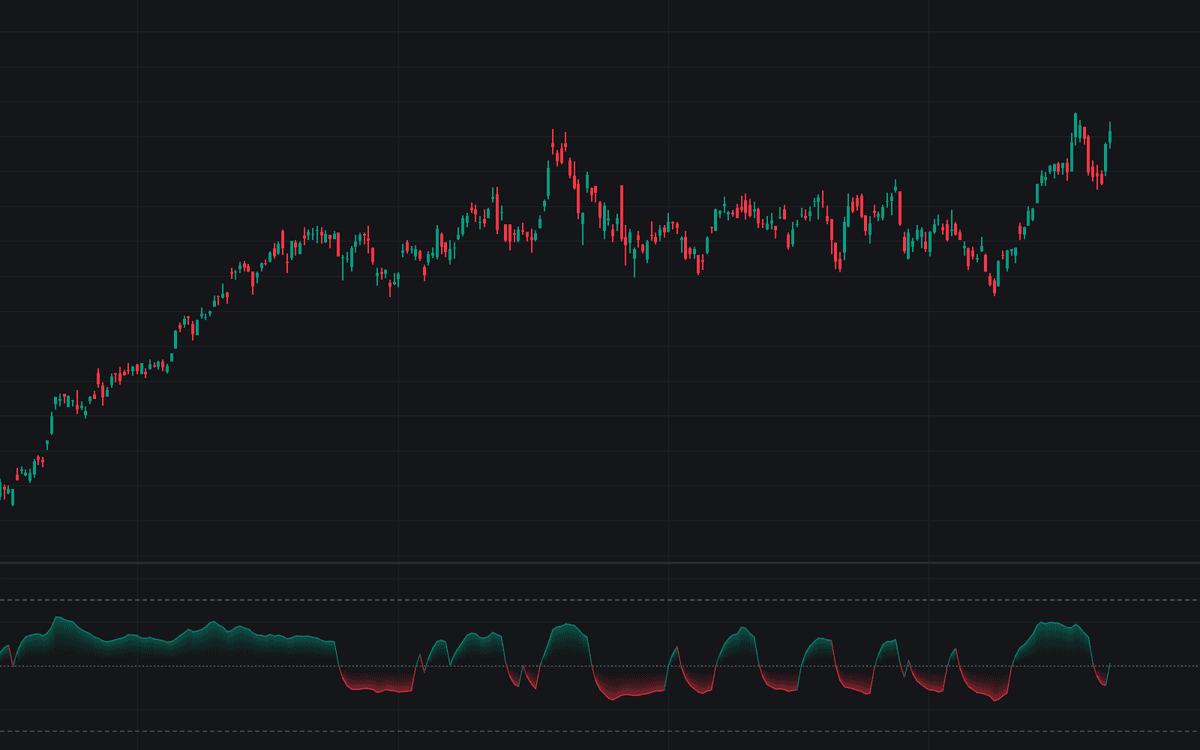

Demand Index is the first faithful Library build of Sibbet's Demand Index, keeping both sides of the market alive on every bar. Volume, normalized by its recent average, is split into buying and selling pressure according to the size of the volatility-scaled move in the weighted price; the components are averaged over the pressure window and their signed ratio plots as a zero-centered oscillator with a gradient fill.
How to Trade the Demand Index?
- Cross above zero: buying pressure has overtaken selling pressure; the mirrored cross marks dominant supply.
- Spike beyond +3: an extreme buying-pressure reading. Under Sibbet's rules such peaks tend to precede a later retest or new price high rather than the final top; the -3 mirror covers lows.
- Divergences: price at a lower low as the index bottoms higher hints at fading supply, the reverse at fading demand; both alert even when drawing is disabled.
The index belongs to the Library's volume and order-flow family, and its premise is that participation shifts before price fully resolves, which is why divergence behavior, more than mechanical crosses, carries its reputation.
Demand Index Settings
- Pressure Window (default 10): bars the two pressure components are averaged over.
- Volume Normalization Length (default 10): average that scales each bar's volume.
- Volatility Length (default 10): average of the two-bar range that scales the price-change term.
- Smoothing Method (default EMA) and Smoothing Length (default 3): final smoothing of the raw ratio; 1 disables it.
- Upper Extreme Level (default 3) and Lower Extreme Level (default -3): the dashed extreme lines and their alerts.
- Show Divergences (default off) with Pivot Lookback Left (default 5) and Pivot Lookback Right (default 5): pivot rules for divergences.
- Bullish, bearish, and level colors.
Frequently Asked Questions

The Library is free. Quant makes it yours.
Pull any concept or indicator into Quant: rebuild it, retune it, or turn it into a backtested strategy of your own.