Concept
Demand Index
Demand Index is a Volume & Order Flow concept. The Library holds 1 implementation, a working definition you can pull into Quant.
Sibbet
Top Demand Index indicator
The top custom implementation, built on the original standard Demand Index formula.
1 total
The Demand Index implementation below can become a backtested trading strategy — describe your rules and Quant writes the code.
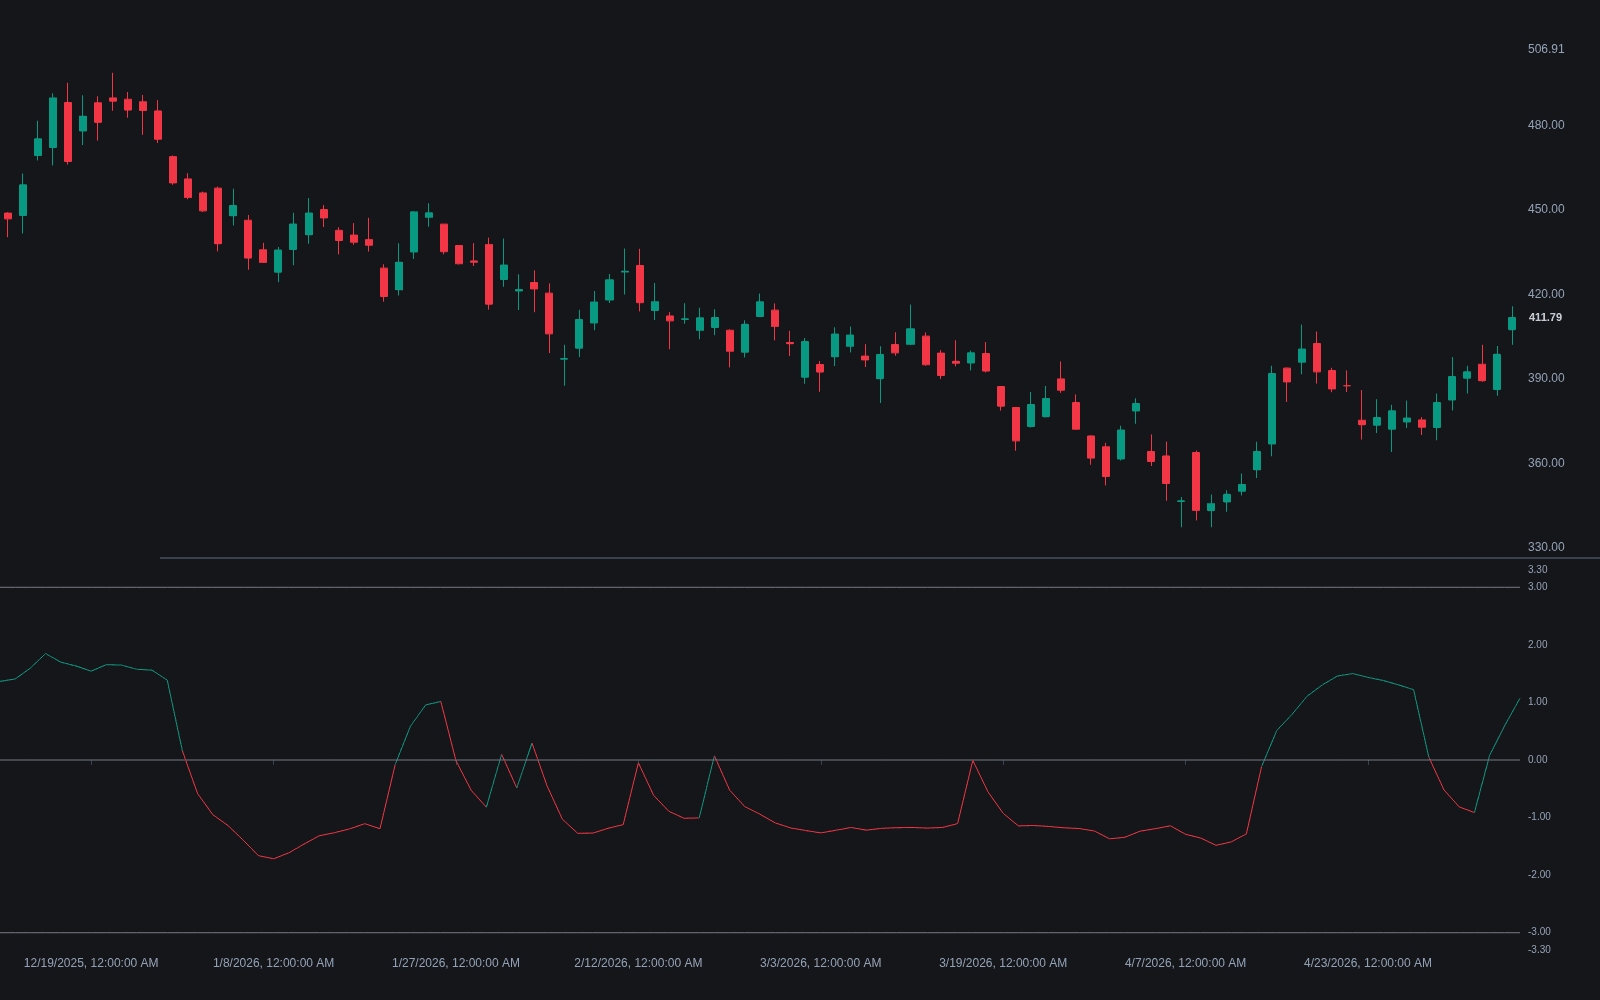
What is the Demand Index?
The Demand Index is a composite indicator developed by James Sibbet that combines price change and volume into a single measure of buying pressure relative to selling pressure. Rather than assigning each bar's whole volume to one side the way On-Balance Volume does, it maintains two separate quantities, buying pressure and selling pressure, and expresses the indicator as a ratio between them, so both forces are always represented and the output reflects their balance.
Sibbet's premise was that volume tends to lead price: shifts in the balance of demand and supply show up in participation before they fully resolve into trend. The indicator's construction reflects that intent, with the size of the price move scaling how volume is split between the two pressure components, and volatility normalization keeping instruments and eras comparable. Readings oscillate around a zero line (some platforms center it on one instead), with positive territory indicating dominant buying pressure and negative territory dominant selling pressure.
Traders care about the Demand Index mostly for its divergence behavior and leading tendencies rather than as a mechanical signal generator. Sibbet published a set of interpretive rules for it, including that divergences between the index and price warn of weakness, that extreme peaks tend to be followed by new price highs after some delay, and that a persistent hover near the zero line signals a weakening trend. Like all such rules these are tendencies observed by the author, not laws.
How it's calculated
There is no single universally published closed form; implementations follow Sibbet's original construction with platform-specific details. The standard shape is:
Implementations differ in smoothing lengths, the volatility normalization window, and whether the output is centered on zero or on one. Compare values only within one platform's implementation.
How traders use it
- Divergence analysis: price making new highs while the Demand Index makes lower highs is the classic warning of fading demand, and the mirror applies at lows. This is the most cited use of the tool.
- Zero-line context: sustained readings above zero support treating rallies as demand-driven; a long hover near zero during a trend is read as the trend losing sponsorship.
- Leading extreme reads: following Sibbet's rules, an extreme spike in the index is often expected to precede a retest or new extreme in price rather than mark the final top or bottom itself.
- Limitations: the formula is complex and implementations vary, so behavior differs across platforms; signals are tendencies rather than triggers, and the index can stay divergent from price for long stretches. Most users pair it with price structure before acting.
Demand Index vs other price-volume composites
Force Index: Elder's Force Index multiplies the close-to-close change by volume into one signed number per bar. The Demand Index instead keeps buying and selling pressure as separate components and reports their ratio.
Money Flow Index: MFI is a bounded 0-100 oscillator built from typical price and volume with a fixed RSI-style construction. The Demand Index is unbounded around its centerline and uses volatility-scaled price change, making it less standardized but more sensitive to move size.
Concept family
Volume & Order Flow
88 concepts mapped · 88 in the Library
Demand Index FAQ
Turn Demand Index into a trading strategy.
Take the implementation from this page into Quant, then build on it, backtest it on real data, and keep refining it in conversation.