Donchian Width
 By LuxAlgoMay 31, 2026
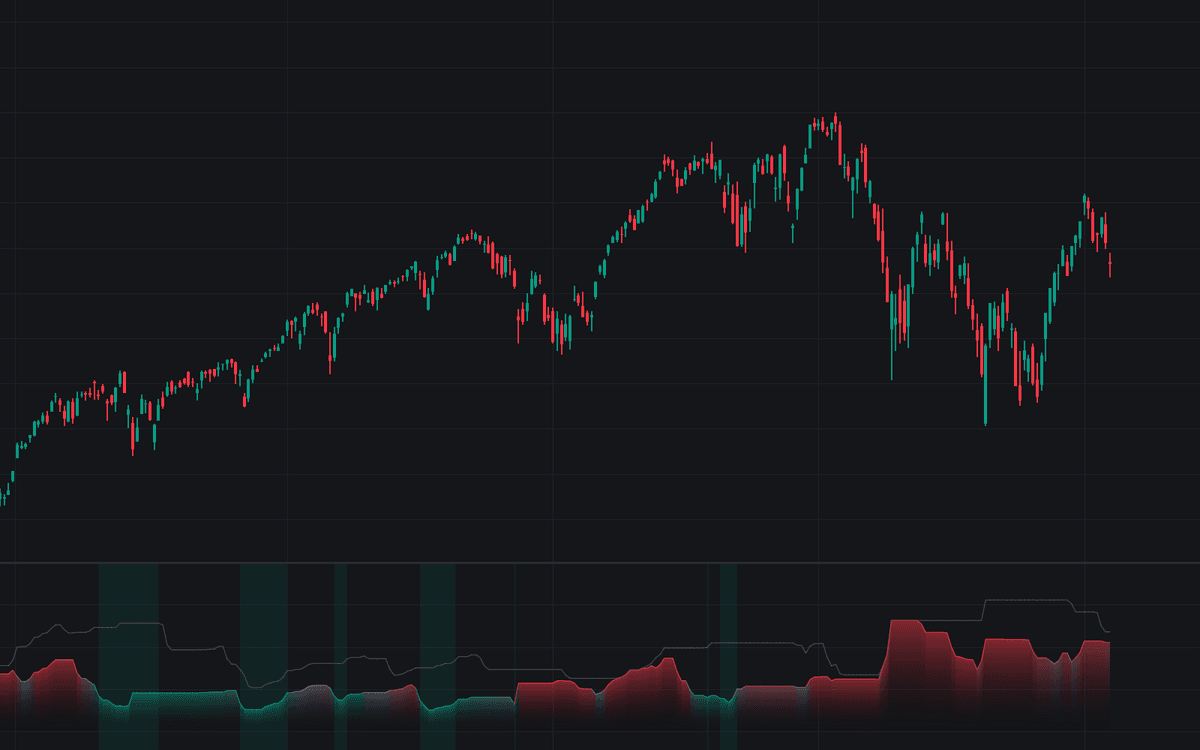

Donchian Width plots the vertical span of a Donchian channel (the window's highest high minus its lowest low) as a volatility series, normalized to the channel midline by default so readings line up across markets and time. This implementation of Donchian width ranks the fast width against its own last 100 bars, shades the pane when that rank falls into compression or stretches into extreme territory, and overlays an optional slow width for a two-speed view.
How to Trade the Donchian Width?
- Compression highlight: width at or below the 20th percentile of its recent history, a narrow tape worth screening for, even though it schedules nothing.
- Confirmed Expansion Up / Down: width turning higher while price takes out a channel extreme, expansion with direction attached.
- Extreme width: a rank at or above the 80th percentile marks late, stretched trend context with worse initial risk for fresh breakouts.
- Fast against slow: the 20-bar width reads tactically while the 55-bar campaign width says whether the larger structure is opening up, a pairing echoed across the volatility family.
Width moves in steps: it jumps when a fresh extreme prints and decays as an old one ages out, so plateaus are normal.
Donchian Width Settings
- Fast Length (default 20): lookback of the fast channel.
- Slow Width (default enabled, 55-bar lookback): the optional campaign-window span.
- Normalization (default Channel Midline (%)): raw price units, percent of the midline, or percent of the close.
- Percentile Lookback (default 100): past bars the current width is ranked against.
- Compression Percentile (default 20) and Extreme Width Percentile (default 80): the rank thresholds defining the two regimes.
- Compression Highlight (default enabled) and Extreme Width Highlight (default disabled) shade the pane background.
Frequently Asked Questions

Original indicatorBuilt in-house by LuxAlgo
The Library is free. Quant makes it yours.
Pull any concept or indicator into Quant: rebuild it, retune it, or turn it into a backtested strategy of your own.