Concept
Donchian Width
Donchian Width is a Volatility concept. The Library holds 1 implementation, a working definition you can pull into Quant.
Top Donchian Width indicator
The top custom implementation, built on the original standard Donchian Width formula.
1 total
From studying Donchian Width to trading it: take the implementation below into Quant and backtest it instantly.
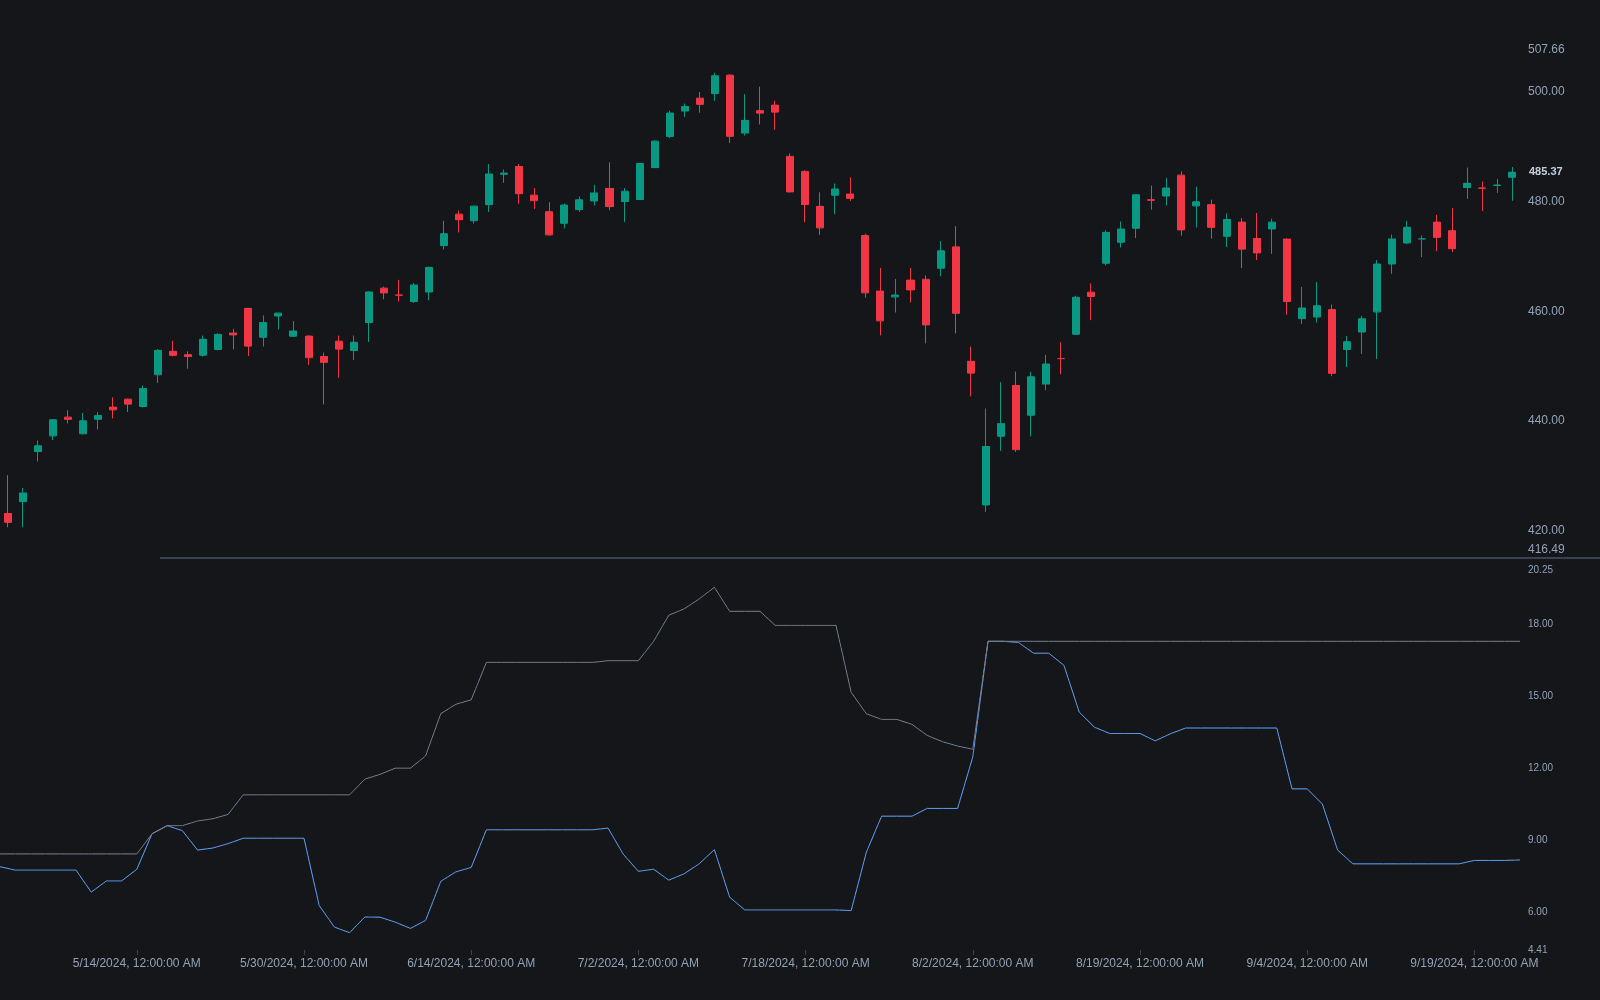
What is Donchian Width?
Donchian width is the vertical distance between the upper and lower lines of Donchian channels: the highest high of the last N bars minus the lowest low over the same window. Because it is built from range extremes rather than dispersion around a mean, it behaves differently from deviation-based measures: it can only expand when price prints a new extreme, and it only contracts when an old extreme ages out of the lookback. The result is a step-like series that summarizes how much ground price has actually covered.
The parent channels carry the lineage: Richard Donchian's mid-century trend-following rules made the N-bar high-low envelope famous, and the Turtle systems' 20- and 55-day breakouts cemented the lookbacks that still serve as defaults. The width is the channel's derived statistic, the same information the breakout rules use, repackaged as a volatility series instead of a trigger.
Raw width is in price units, so it is usually normalized, divided by the channel midline or the close, before readings are compared across instruments or across time. Narrow width reads as compression, widening as range expansion; neither says anything about direction on its own.
The step-behavior is the personality to internalize. Width jumps the bar a new extreme prints, then plateaus; it decays only on the schedule of old extremes leaving the window, so a single climactic bar props the reading for exactly N bars. That makes Donchian width blunt but honest: it measures traveled span, not statistical dispersion, ignores everything inside the extremes, and pairs naturally with a percentile view so 'narrow' and 'wide' are judged against the instrument's own history.
How to read Donchian width
The series is read against its own history, with its step mechanics kept in mind.
- 1Plot the width (or its normalized form) for your channel lookback; 20 bars is the classic short window, 55 the classic long one.
- 2Interpret the steps: jumps mark fresh extremes printing, plateaus mark containment, and declines mean old extremes aged out without replacement.
- 3Judge compression by rank: width in the low percentiles of its own recent history is the screenable 'narrow' that precedes many expansions.
- 4Confirm expansion with the channel event: width turning up as price clears a channel extreme distinguishes funded breaks from marginal pokes.
- 5Cross-check a dispersion measure: BandWidth reacting while Donchian width sleeps means volatility inside unchanged extremes, and the reverse flags gap-driven span.
- 6Take direction from structure: span says how far the market traveled, never which way it goes next.
How it's calculated
Measures volatility as the vertical distance between the Donchian channel's highest high and lowest low bounds.
Some implementations compute the bounds over bars t-n through t-1, excluding the current bar, to match the original breakout rules.
The percent form makes widths comparable across symbols and price regimes.
Narrowing width marks range compression; expanding width accompanies breakouts.
How traders use it
- As a compression screen: width that is narrow relative to its own recent history flags consolidations where a breakout attempt becomes more likely, though never scheduled.
- As expansion confirmation: width turning up as price clears a channel extreme distinguishes genuine range expansion from a marginal poke above old highs.
- As a volatility input: normalized width can drive adaptive lookbacks, stop distances, or position sizing much like ATR, with the caveat that it updates only when extremes change.
- As trend-maturity context: in Donchian-style systems, unusually wide width after a long run marks a late, stretched trend where fresh breakout entries carry worse initial risk, since the stop (the opposite channel line) sits a full span away.
- In squeeze stacks: Donchian compression alongside a Bollinger squeeze or TTM squeeze state means extremes and dispersion agree the market is coiled, a stronger arming condition than either alone.
Donchian width vs other volatility measures
BandWidth: BandWidth tracks standard deviation around a mean, so it moves every bar and reacts quadratically to shocks. Donchian width moves only on new extremes or expiring ones, a pure span measure: steadier, blunter, and immune to everything that happens inside the range.
ATR: ATR averages per-bar travel including gaps, a flow measure of volatility; Donchian width is the stock, total span covered over the window. A market of violent bars inside fixed extremes prints high ATR and flat width, the disagreement that tells you which kind of volatility is present.
Donchian Channels: The channels are the level tool: breakout triggers at the extremes, midline for exits. The width is their derived statistic, converting the same two lines into a volatility series for screening, sizing, and regime work.
Concept family
Volatility
57 concepts mapped · 57 in the Library
Donchian Width FAQ
Turn Donchian Width into a trading strategy.
Take the implementation from this page into Quant, then build on it, backtest it on real data, and keep refining it in conversation.