Dynamic Momentum Index
 By LuxAlgoApr 24, 2026
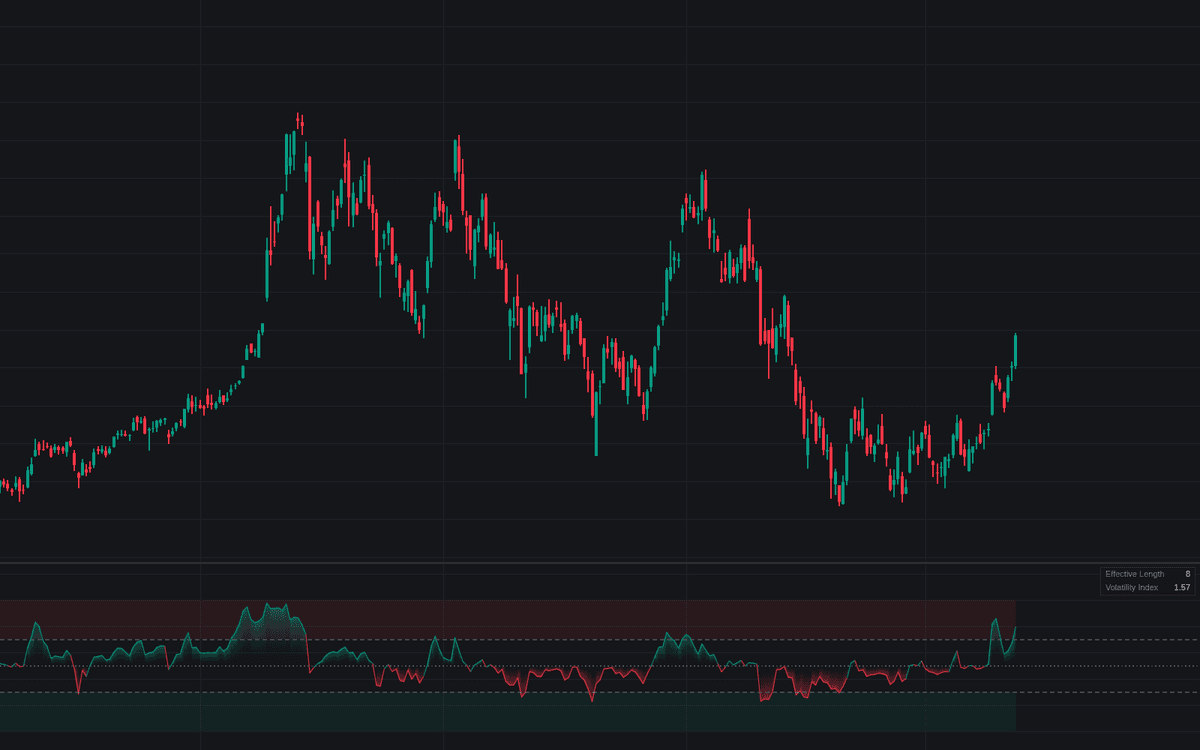

Dynamic Momentum Index is an RSI whose lookback is re-derived on every bar. The Library's first build of the Dynamic Momentum Index divides the base period by a volatility index and reads a standard Wilder RSI at that adaptive length, exactly as Chande and Kroll specified: above-normal volatility contracts the effective period toward the minimum, quiet markets stretch it toward the maximum. A dashboard reports the current effective length and volatility index, and an optional stepline plots the length so the adaptation stays visible.
How to Trade the Dynamic Momentum Index?
- Overbought / oversold: readings beyond 70/30 carry the usual RSI conventions, with alerts on entering and exiting each zone; extremes arrive earlier because the period contracts in fast markets.
- Centerline regime: the 50 line splits bullish from bearish momentum. The plot is colored and gradient-filled by side, and both crossings carry alerts.
- Effective length as context: a short reading means signals come from a twitchy, fast oscillator; a long one means the market is quiet and readings are steadier.
Dynamic Momentum Index Settings
- Source (default close): series for both the volatility index and the RSI.
- Base RSI Length (default 14): the period being adapted, divided by the volatility index each bar.
- Volatility Stdev Length (default 5) and Volatility Average Length (default 10): the deviation window and its comparison average.
- Minimum RSI Length (default 5) and Maximum RSI Length (default 30): the clamps on the dynamic lookback.
- Overbought Level (default 70) and Oversold Level (default 30): the zone thresholds.
- Dashboard and style toggles: panel location and size, colors, and the effective-length stepline (disabled by default).
Frequently Asked Questions

Original indicatorBuilt in-house by LuxAlgo
The Library is free. Quant makes it yours.
Pull any concept or indicator into Quant: rebuild it, retune it, or turn it into a backtested strategy of your own.