Ergodic Oscillator
 By LuxAlgoApr 15, 2026
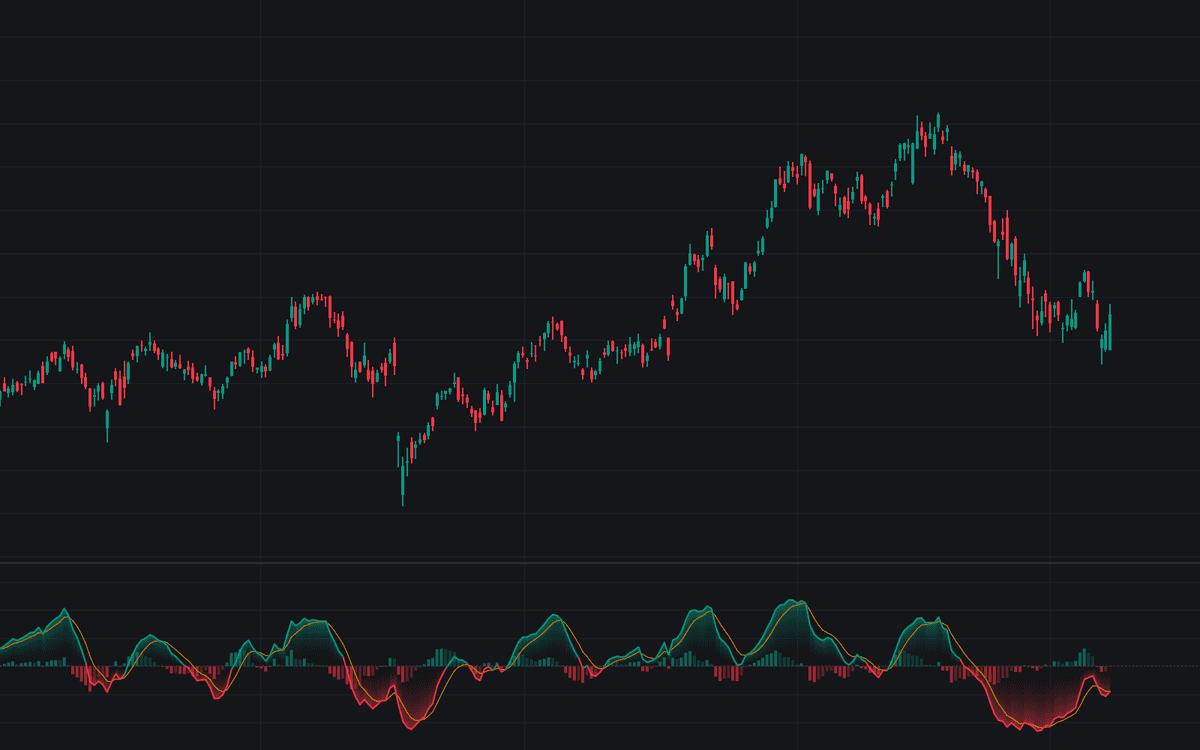

Ergodic Oscillator plots William Blau's double-smoothed momentum ratio: one-bar price change passed through a 20-length and then a 5-length EMA, divided by the identical pipeline applied to the absolute change, and scaled to +/-100. Because numerator and denominator carry the same lag, the ergodic oscillator reads as a bounded, unusually smooth momentum line; the build adds a 5-period signal line and a histogram of their gap whose shading encodes acceleration.
How to Trade the Ergodic Oscillator?
- Signal-line crosses: the momentum triggers, best taken with the zero line or a trend filter as referee.
- Zero crosses: net double-smoothed momentum changing sign, the slower trend-change cue.
- Fading histogram: bright columns mark a widening line-signal gap; faded columns mean it is closing: momentum rolling over before the cross, alertable both ways.
- Extreme-band entries: pushes beyond the bands are overbought or oversold context. Stand down on fresh entries rather than fade automatically.
Like most of the momentum family, it reads best as a timing layer: zero line for regime, crosses for moments.
Ergodic Oscillator Settings
- Source (default close).
- Long Smoothing Length (default 20): the first EMA stage. Longer settings slow and clean the line for regime and divergence reads.
- Short Smoothing Length (default 5): the second EMA stage, the responsiveness fine-tune.
- Signal Length (default 5): EMA of the ergodic line forming the signal.
- Extreme Bands (default disabled; Upper 25, Lower -25): dashed context levels (extremes are instrument-specific), and the band alerts fire regardless.
- Style toggles: Show Histogram and Gradient Fill default on, plus line, signal and level colors.
Frequently Asked Questions

Original indicatorBuilt in-house by LuxAlgo
The Library is free. Quant makes it yours.
Pull any concept or indicator into Quant: rebuild it, retune it, or turn it into a backtested strategy of your own.