Concept
Ergodic Oscillator
Ergodic Oscillator, also known as SMI Ergodic, is a Momentum & Oscillators concept. The Library holds 1 implementation, a working definition you can pull into Quant.
Top Ergodic Oscillator indicator
The top custom implementation, built on the original standard Ergodic Oscillator formula.
1 total
The Ergodic Oscillator implementation below can become a backtested trading strategy — describe your rules and Quant writes the code.
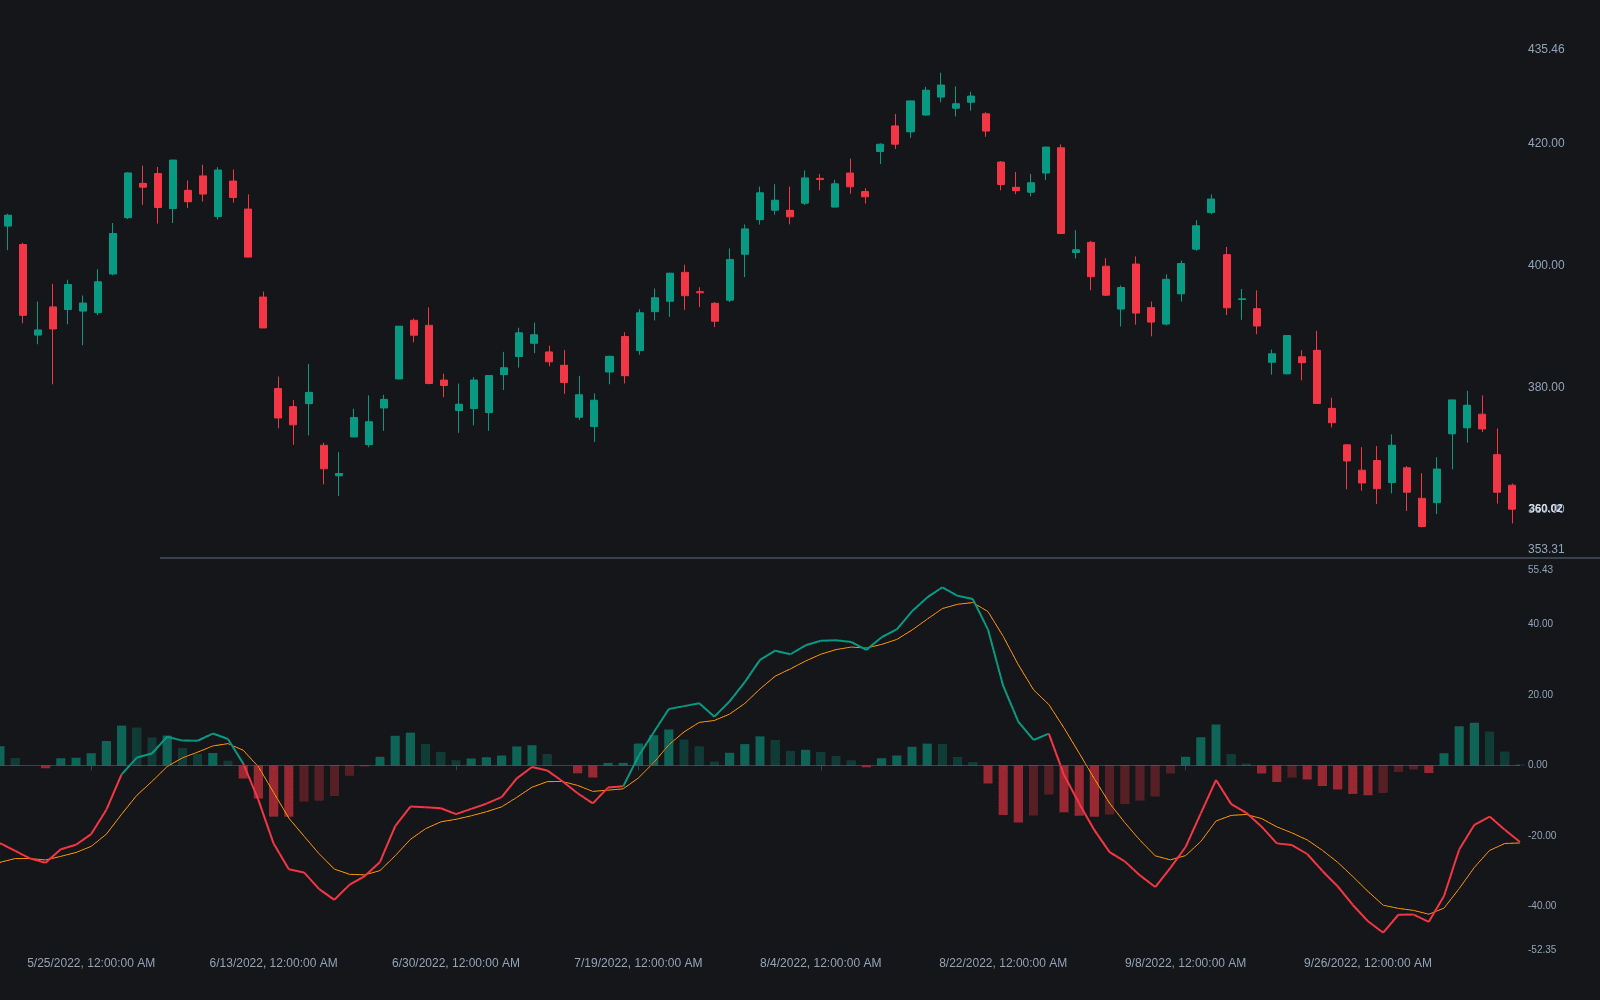
What is the Ergodic Oscillator?
The Ergodic Oscillator comes from William Blau's double-smoothing framework for momentum. Blau took one-bar price change, smoothed it twice with EMAs, and divided by the equally double-smoothed absolute price change, scaling the bounded ratio to plus or minus 100; that construction is his True Strength Index, and 'ergodic' is the label he gave indicators built this way. In the commonly charted form (often named SMI Ergodic) the ergodic line is paired with a signal line, an EMA of the ergodic, and the 'oscillator' variant plots the difference between the two as a histogram.
Blau developed the approach in Technical Analysis of Stocks & Commodities articles in the early 1990s and collected it in his 1995 book Momentum, Direction, and Divergence. His argument was that raw momentum is too noisy to read directly, that a single heavy smoothing arrives too late, and that two successive EMAs applied to one-bar momentum strip noise while keeping more of the turn timing. Normalizing by the double-smoothed absolute change then rescales the result into a bounded oscillator, comparable across instruments the way RSI is and unlike an unbounded rate of change.
Platform naming is inconsistent: the same construction appears as TSI, Ergodic, or SMI Ergodic, and despite that last label it is distinct from Blau's Stochastic Momentum Index, which measures the close against the midpoint of the high-low range instead. What defines the family is the mechanism: double smoothing strips most bar-to-bar noise, and normalizing by absolute momentum keeps the output bounded, so zero-line position tracks net direction while signal-line crossings mark momentum turns with modest lag.
Parameter conventions vary; SMI Ergodic implementations commonly default to a long smoothing near 20, a short near 5, and a 5-period signal line. Longer first-stage smoothing gives a slower, cleaner line for regime and divergence work; shorter settings act more like a responsive trigger. Because the ratio compares net change to total change, it measures directional consistency rather than size: a drift of small one-way bars can print as strongly as a powerful trend, which deserves skepticism in thin markets.
How to Identify the Ergodic Oscillator on a Chart
In an indicator pane, the ergodic family has a recognizable signature:
- 1Look for a smooth line around a zero centerline, scaled to roughly plus or minus 100 (or 1) rather than 0-100.
- 2Find the companion signal line, an EMA of the main line; the pair moves like a slower, rounder MACD.
- 3Check for the histogram variant plotting the gap between the ergodic line and its signal.
- 4Inspect the inputs: two smoothing lengths plus a signal length, commonly near 20, 5, and 5, mark Blau's double-smoothing design.
- 5Confirm the character: notably smoother than RSI or raw momentum at comparable lengths, with rounded turns rather than jagged ones.
How it's calculated
A double-smoothed ratio of net price change to absolute price change, bounded between -100 and +100 and plotted with a signal line.
Identical in form to William Blau's True Strength Index; TSI defaults r = 25 and s = 13 are also common.
Double-smoothing abs(mtm) in the denominator keeps the output inside -100 to +100.
Some platforms plot only the line and signal and omit the Osc_t histogram.
How traders use it
- Signal-line crossings as momentum triggers: the ergodic line crossing its EMA signal is read much like a MACD cross, typically filtered by zero-line position or a trend gauge to cut counter-trend noise.
- Zero-line regime reads: sustained positive values indicate net upside momentum after heavy smoothing, so the zero cross itself doubles as a slow trend-change cue.
- Divergence analysis: the double smoothing produces clean swing peaks, making regular divergences between the ergodic line and price extremes easier to spot ahead of potential exhaustion, with hidden divergence serving the continuation case.
- Bounded-extreme context: traders mark instrument-specific extreme bands and treat visits as overbought or oversold conditions, standing down on fresh momentum entries rather than automatically fading.
- Histogram deceleration: a shrinking gap between line and signal flags momentum rolling over before the actual cross, the same early-warning read applied to the MACD histogram.
Ergodic Oscillator vs related concepts
MACD: MACD subtracts two EMAs of price, so it is unbounded and its scale drifts with price level. The ergodic normalizes double-smoothed momentum by absolute momentum, giving a bounded, comparable line at the cost of an extra smoothing stage.
Stochastic Momentum Index: Also Blau, but a different question: SMI double-smooths the close's distance from the midpoint of the high-low range. The SMI Ergodic label on many platforms actually denotes the TSI-style construction, so check the formula, not the name.
RSI: RSI averages gains against losses over one window, reacting faster but printing far more texture. The ergodic's two-stage smoothing trades that immediacy for cleaner swings, which is what makes its crosses and divergences easier to read.
Concept family
Momentum & Oscillators
91 concepts mapped · 91 in the Library
Ergodic Oscillator FAQ
Turn Ergodic Oscillator into a trading strategy.
Take the implementation from this page into Quant, then build on it, backtest it on real data, and keep refining it in conversation.