


Evasive SuperTrend
Feb 18, 2026
The Evasive SuperTrend is an advanced trend-following trading indicator built to solve one of the most common problems traders face: false trend reversals during choppy, noisy market conditions. By integrating adaptive “evasive” logic into the classic SuperTrend framework, this indicator intelligently adjusts its volatility band when price action becomes too close, helping traders stay in strong trends longer and avoid unnecessary whipsaws.
Unlike the traditional SuperTrend trading indicator, which can only trail price in a fixed, monotonic way, the Evasive SuperTrend dynamically expands its band when market noise increases. This creates a more robust trend-following strategy suitable for forex, crypto, stocks, and futures traders who want cleaner signals and improved trade management.
How to Trade the Evasive SuperTrend Indicator
The Evasive SuperTrend can be used similarly to a standard SuperTrend trading strategy to determine trend direction and trailing stop placement. However, it adds an intelligent layer of noise filtering that makes it more reliable during consolidation phases.
Traders can use this tool to:
- Identify bullish and bearish trends
- Set adaptive trailing stop-loss levels
- Avoid premature exits during sideways markets
- Confirm stronger breakout conditions
Identifying Trend Direction and Market Noise
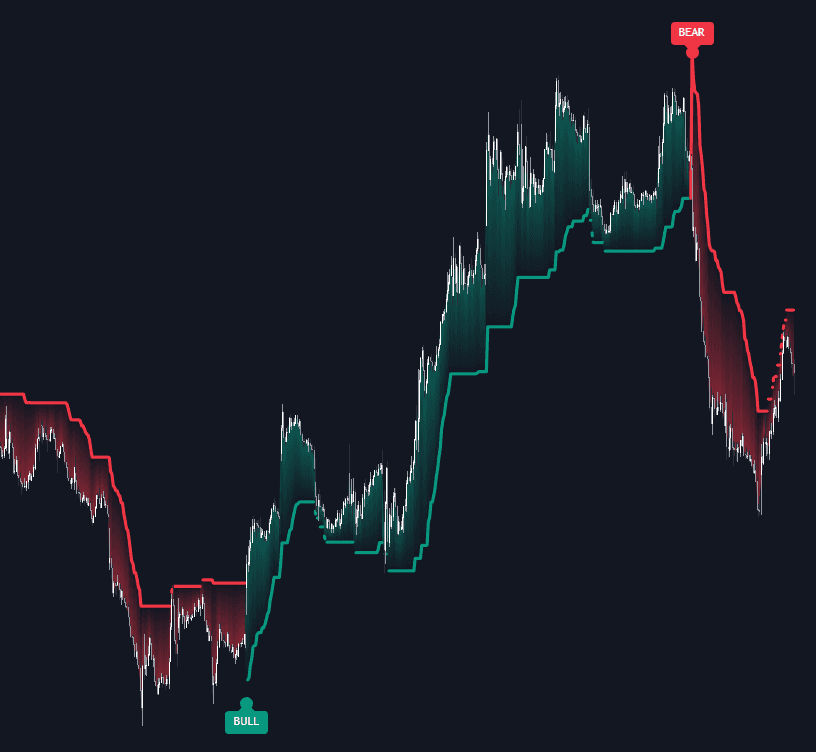
The indicator provides multiple visual cues to help traders understand both trend structure and market conditions.
-
Solid Line: Represents a standard trend phase. In this mode, price maintains a healthy distance from the volatility band, indicating stable directional momentum.
-
Dotted Line (Evasive Mode): Activates when price enters a defined “Noise Zone.” In this phase, the indicator proactively pushes the band further away from price to avoid triggering a false trend reversal caused by minor volatility spikes.
-
Gradient Fill: A dynamic background heat map that visualizes trend strength. As price approaches the band, transparency increases, signaling growing pressure and a higher probability of a potential trend flip.
This layered visualization makes the Evasive SuperTrend not just a trailing stop tool, but a complete trend analysis indicator.
Trading Signals and Trend Reversals
The indicator prints clear BULL and BEAR labels when a confirmed trend flip occurs.
Because the band retreats during noisy conditions, a trend reversal requires price to overcome an adaptive volatility threshold. This means:
- Trend flips tend to be more meaningful.
- Breakouts often carry stronger momentum.
- Whipsaws are significantly reduced compared to traditional SuperTrend strategies.
For trend traders, this creates higher-confidence entries and exits. For swing traders, it offers cleaner structural shifts. For scalpers, it reduces overtrading during consolidation.
How the Noise Avoidance Logic Works
The core innovation behind the Evasive SuperTrend is its Noise Avoidance Logic.
Standard SuperTrend indicators are strictly monotonic:
- In a bull trend, the band only moves upward or stays flat.
- In a bear trend, the band only moves downward or stays flat.
This rigidity often causes minor price spikes to touch the band and force unnecessary trend flips.
The Evasive SuperTrend introduces a Noise Threshold, measured in ATR (Average True Range) units. When price moves too close to the band:
- The indicator detects entry into the Noise Zone.
- Instead of waiting for a breakout, the band expands away from price.
- The trend is given “breathing room” to continue.
This adaptive volatility response makes it particularly effective in:
- Ranging markets
- High-frequency noise environments
- Lower timeframes with frequent micro pullbacks
- Volatile crypto and forex sessions
The result is a smarter trend-following indicator that balances responsiveness with stability.
SETTINGS
SuperTrend Settings
These parameters control the baseline behavior of the trend-following system.
-
ATR Length: Defines the lookback period used to calculate the Average True Range. Higher values smooth volatility calculations, while lower values make the indicator more reactive.
-
Base Multiplier: Determines the initial distance between price and the volatility band. Larger multipliers produce fewer but longer-lasting trend signals. Smaller values generate more frequent signals suitable for short-term trading strategies.
Noise Avoidance Logic Settings
These inputs control the evasive behavior and directly impact how resistant the indicator is to market noise.
-
Noise Threshold (xATR): Defines the ATR-based “danger zone” near the band. When price enters this zone, evasive mode activates. Increasing this value makes the indicator more sensitive to nearby price action.
-
Expansion Alpha (xATR): Determines how far the band expands when noise is detected. Higher values make the indicator more “stubborn” and less likely to flip trends prematurely.
Traders can fine-tune these settings depending on whether they prefer:
- Aggressive early reversals
- Conservative long-term trend holding
- Scalping strategies
- Swing trading setups
Visualization Options
- Show Signal Labels: Enables or disables the BULL and BEAR trend-change markers.
- Show Gradient Fills: Toggles the dynamic background heat map between price and the band for enhanced trend strength visualization.
These visualization controls allow traders to adapt the indicator to clean chart layouts or more data-rich analytical views.
FAQ
What makes the Evasive SuperTrend different from a regular SuperTrend?
The Evasive SuperTrend includes adaptive Noise Avoidance Logic that expands the volatility band when price gets too close. This reduces false trend flips and helps traders stay in valid trends longer.
Is this indicator suitable for all markets?
Yes. The Evasive SuperTrend can be applied to stocks, forex, cryptocurrencies, and futures across multiple timeframes. It is especially effective in volatile or choppy markets where traditional trend indicators often struggle.
How should I use this in a trading strategy?
Traders typically use the indicator for:
- Trend confirmation
- Breakout validation
- Trailing stop placement
- Filtering entries from other indicators such as momentum oscillators or structure-based tools
It works well as both a standalone trend-following indicator and as part of a multi-indicator trading strategy.
How can I access the Evasive SuperTrend?
You can get access on the LuxAlgo Library for charting platforms like TradingView, MetaTrader (MT4/MT5), and NinjaTrader for free.
Trading & investing are risky and many will lose money in connection with trading and investing activities. All content on this site is not intended to, and should not be, construed as financial advice. Decisions to buy, sell, hold or trade in securities, commodities and other investments involve risk and are best made based on the advice of qualified financial professionals. Past performance does not guarantee future results.
Hypothetical or Simulated performance results have certain limitations. Unlike an actual performance record, simulated results do not represent actual trading. Also, since the trades have not been executed, the results may have under-or-over compensated for the impact, if any, of certain market factors, including, but not limited to, lack of liquidity. Simulated trading programs in general are designed with the benefit of hindsight, and are based on historical information. No representation is being made that any account will or is likely to achieve profit or losses similar to those shown.
Testimonials appearing on this website may not be representative of other clients or customers and is not a guarantee of future performance or success.
As a provider of technical analysis tools and strategies, we do not have access to the personal trading accounts or brokerage statements of our customers. As a result, we have no reason to believe our customers perform better or worse than traders as a whole based on any content, tool, or platform feature we provide.
Charts used on this site are by TradingView in which the majority of our technical indicators are built on. TradingView® is a registered trademark of TradingView, Inc. www.TradingView.comTradingView® has no affiliation with the owner, developer, or provider of the Services described herein.
Market data is provided by CBOE, CME Group, BarChart, CoinAPI. CBOE BZX real-time US equities data is licensed from CBOE and provided through BarChart. Real-time futures data is licensed from CME Group and provided through BarChart. Select cryptocurrency data, including major coins, is provided through CoinAPI. All data is provided “as is” and should be verified independently for trading purposes.
This does not represent our full Disclaimer. Please read our full disclaimer.
© 2026 LuxAlgo Global, LLC.