EWMA Volatility
 By LuxAlgoJun 16, 2026
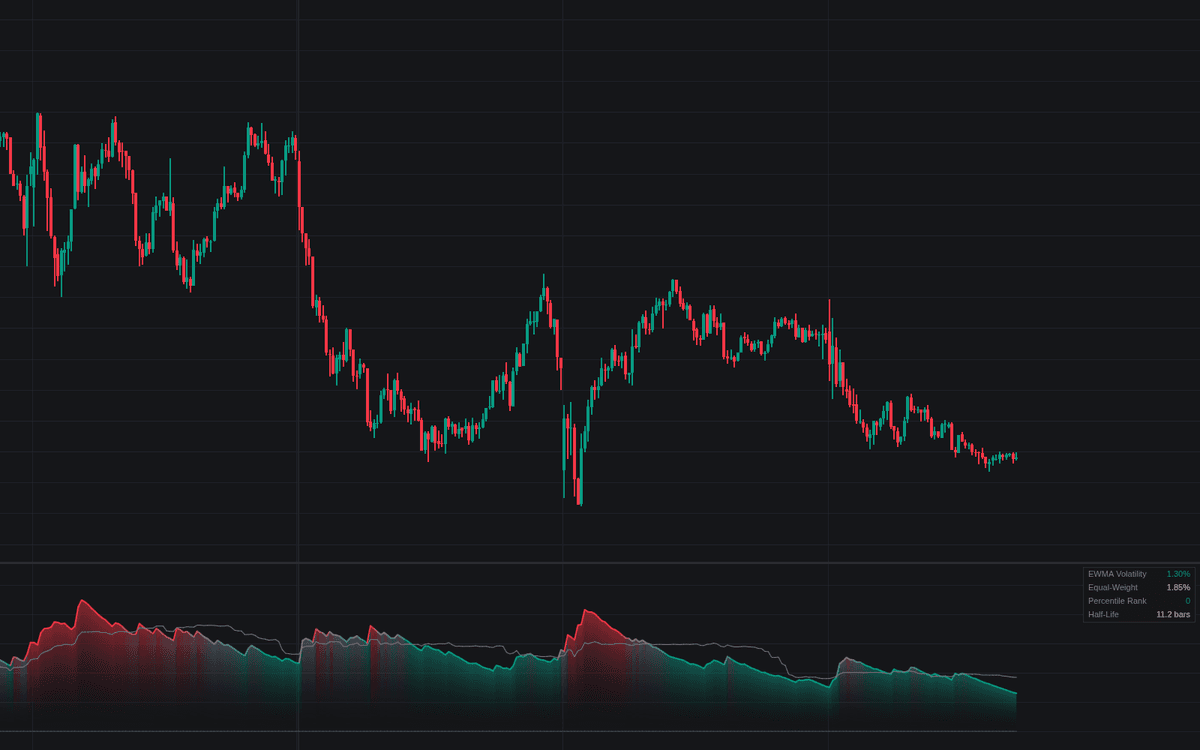

EWMA Volatility is the definitive clean build of EWMA volatility estimation: each bar the variance estimate keeps a lambda share of yesterday's estimate and takes the rest from yesterday's squared log return, so a shock enters immediately and decays geometrically instead of dropping out of a window. The reading is annualized by default, filled with a gradient anchored at zero, and paired with a slower equal-weight benchmark on the same returns.
How to Trade the EWMA Volatility?
- EWMA above the Equal-Weight line: turbulence is recent and building; the crossover fires the Turbulence Building alert.
- EWMA back below: the shock is decaying. The market is settling.
- Percentile rank above 80: an expansion regime by the instrument's own history.
- Rank below 20: compression, a quiet stretch that often precedes range expansion.
The estimate sizes movement and carries no direction, like everything in the volatility family; use it for expectations and risk, not bias.
EWMA Volatility Settings
- Lambda (Decay Factor) (default 0.94): the RiskMetrics daily convention. Higher decays slower and smoother; lower chases shocks quickly but runs noisier.
- Source (default close): series the close-to-close log returns come from.
- Annualize (default on) and Bars Per Year (default 252): scales the reading for cross-instrument comparison.
- Equal-Weight Comparison (default on) and Comparison Window (default 60): the fixed-window benchmark behind the fast-versus-slow read.
- Percentile Lookback (default 100) with High Percentile (80) and Low Percentile (20): rank thresholds driving the expansion and compression alerts.
- Show Percentile Levels (default off): plots the thresholds as dotted levels.
- Show Dashboard (default on): reading, benchmark, rank and half-life; Gradient Fill (default on) covers the fill.
Frequently Asked Questions

Original indicatorBuilt in-house by LuxAlgo
The Library is free. Quant makes it yours.
Pull any concept or indicator into Quant: rebuild it, retune it, or turn it into a backtested strategy of your own.