Concept
EWMA Volatility
EWMA Volatility, also known as RiskMetrics λ-decay, is a Volatility concept. The Library holds 1 implementation, a working definition you can pull into Quant.
Top EWMA Volatility indicator
The top custom implementation, built on the original standard EWMA Volatility formula.
1 total
The EWMA Volatility implementation below can become a backtested trading strategy — describe your rules and Quant writes the code.
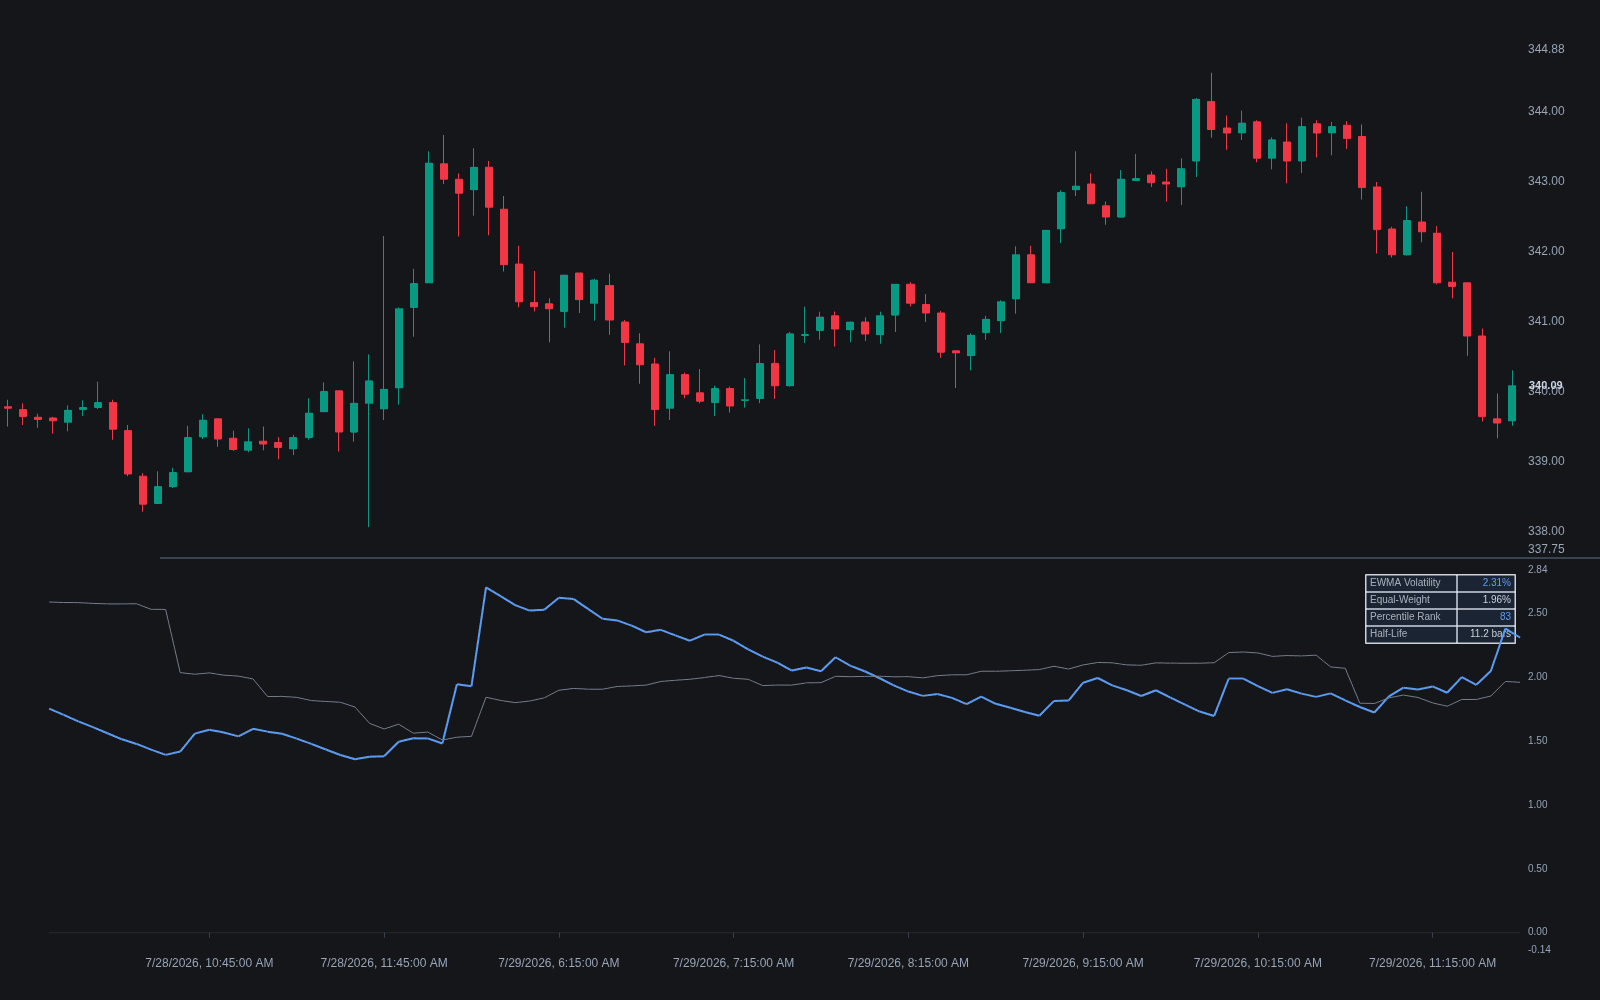
What is EWMA Volatility?
EWMA volatility estimates variance with an exponentially weighted moving average of squared returns: today's estimate equals a decay factor lambda times yesterday's estimate, plus one minus lambda times yesterday's squared return, with the mean return usually set to zero. J.P. Morgan's RiskMetrics methodology popularized the recursion and fixed lambda at 0.94 for daily data, which is why the recursion is often just called the RiskMetrics model. Geometrically decaying weights let the freshest shocks dominate while old ones fade smoothly.
The lineage spans industry and academia. Exponential smoothing was a forecasting workhorse long before finance adopted it; the academic treatment of time-varying volatility arrived with Robert Engle's ARCH model in 1982 and Tim Bollerslev's GARCH generalization in 1986. RiskMetrics, published openly by J.P. Morgan in 1994, chose the EWMA recursion as a pragmatic middle path: it captures the tendency of turbulent periods to follow turbulent periods without any model fitting, and its free publication helped make it a de facto standard for value-at-risk work in the 1990s.
Two properties drive its use. It has no drop-off artifact: rolling realized volatility computed over a fixed window jumps when a large return enters the window and jumps again when it exits, while EWMA decays a shock continuously. And it is the boundary case of the GARCH family with no long-run anchor: it captures the persistence of calm and turbulent stretches but never mean-reverts, so its forecast at any horizon is simply the current estimate.
Lambda has a concrete meaning as memory. The weight on an observation k periods old is proportional to lambda raised to k, so at the daily value of 0.94 the weight halves roughly every 11 trading days: the past month dominates the estimate and data older than a quarter contributes little. The recursion outputs a variance whose square root gives per-bar volatility, usually annualized by the square root of periods per year. Because the input is squared close-to-close returns, gaps enter through the return itself, unlike ATR, which folds them in through true range.
How to Read EWMA Volatility on a Chart
EWMA volatility plots as a smooth line or adaptive band width rather than a price pattern, so reading it is about shape and level.
- 1Plot the estimate in a subpane with an EWMA indicator or a short script of the recursion, choosing lambda for your horizon; 0.94 is the daily default.
- 2Read the shock response: EWMA jumps the bar after a large return, then decays smoothly; a volatility line that steps down with no news is usually a fixed-window estimate dropping its oldest observation, not EWMA.
- 3Compare fast against slow: EWMA volatility above a longer equal-weighted estimate says turbulence is recent and building; crossing back below marks the decay phase.
- 4Watch compressions: an EWMA line grinding to multi-month lows carries the same message as tightening BandWidth or a maturing volatility contraction pattern: quiet that eventually gives way.
- 5Level-check against history: express the reading as a volatility percentile of its own past before calling it high or low; raw values do not compare across instruments.
How it's calculated
An exponentially weighted estimate of return variance in which the newest squared return carries the most weight and older ones decay geometrically.
RiskMetrics popularized the recursion with λ = 0.94 for daily data, giving an effective memory of roughly 1 / (1 - λ) bars (about 17 at 0.94).
It assumes zero mean returns and is seeded with a sample variance over an initial window, whose influence decays by the factor λ each bar.
EWMA is GARCH(1,1) without the long-run variance term, so estimates react quickly to shocks but do not mean revert.
How traders use it
- As the volatility input for risk work: volatility-targeted sizing, value-at-risk style estimates, and volatility-scaled stops benefit from an estimate that updates smoothly every bar.
- As an adaptive width for bands and filters: an envelope built on EWMA variance widens quickly after shocks and tightens as calm returns, without the step changes a fixed rolling window produces.
- As a freshness read: EWMA volatility above a slower equal-weighted estimate says turbulence is recent and building; below it, decaying.
- As a normalizer: dividing returns or indicator readings by EWMA volatility puts instruments and eras on one scale, stabilizing signals otherwise dominated by the most volatile asset.
- As a stop and target scale: multiples of EWMA sigma play the same role as ATR multiples, and bands built from either, such as ATR bands, often frame similar levels.
EWMA Volatility vs Other Volatility Measures
Realized Volatility: Classic realized volatility weights every return in the window equally and forgets each one abruptly at the cutoff. EWMA swaps the hard window for geometric decay, trading a transparent lookback for smoother behavior.
ATR: ATR averages true ranges, so it is denominated in price units, includes gaps and intrabar range, and ignores the statistics of returns. EWMA volatility works on squared returns, the natural input for percentage-based and risk-model uses.
Bollinger Bands: Bollinger Bands apply a fixed-window standard deviation of price around a moving average. EWMA volatility measures return variability with decaying weights, and bands scaled by it adapt faster after shocks without window artifacts.
Concept family
Volatility
57 concepts mapped · 57 in the Library
EWMA Volatility FAQ
Turn EWMA Volatility into a trading strategy.
Take the implementation from this page into Quant, then build on it, backtest it on real data, and keep refining it in conversation.