Expiration Effects
 By LuxAlgoJun 4, 2026
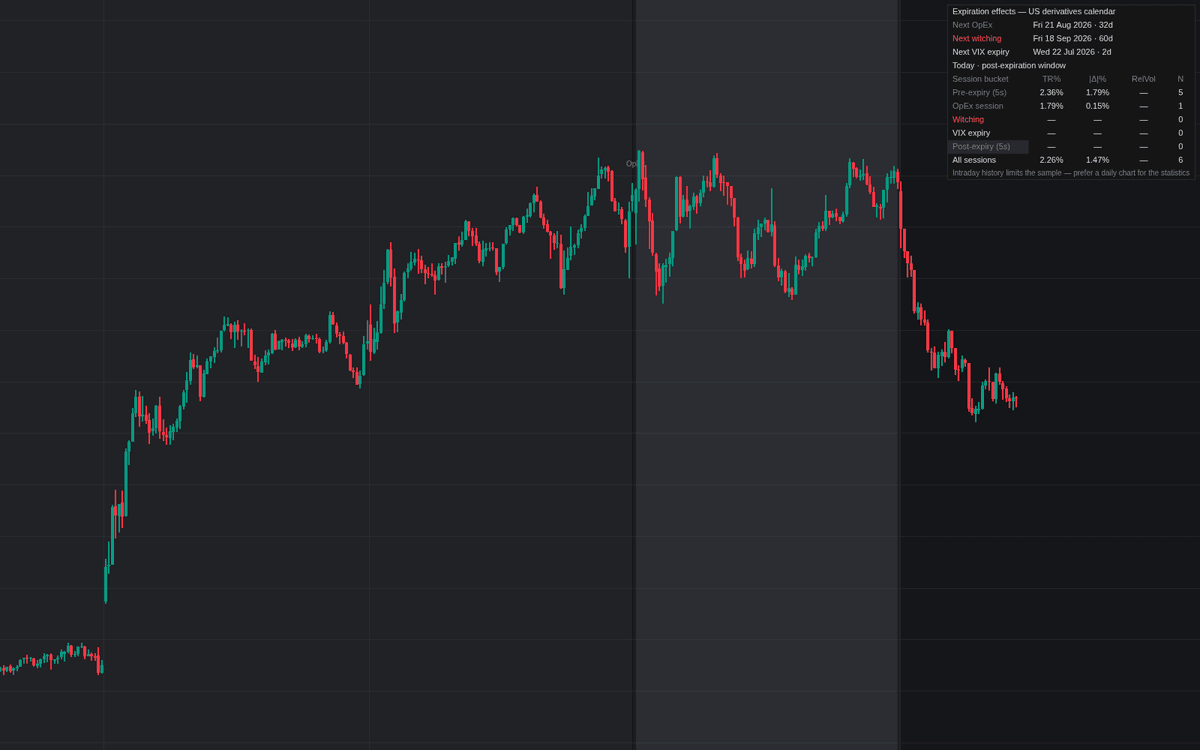

Expiration Effects lays the US derivatives calendar over the chart and audits the folklore against the symbol's own sessions, a first purpose-built implementation of the written concept. Monthly OpEx third Fridays, quarterly witching dates and VIX expiry Wednesdays are computed on the exchange calendar (holiday shifts handled), labeled and shaded, and every completed session is pooled into buckets so the tendencies described under expiration effects can be measured rather than assumed.
How to Trade the Expiration Effects?
- OpEx week shading: Monday through the third Friday is tinted while dealer hedging flow concentrates; the pre-expiry bucket shows whether range actually compresses on this symbol.
- Witching emphasis: the March, June, September and December dates get their own color. Their heavy volume is mechanical, so RelVol spikes there are not ordinary conviction.
- Dashboard buckets: compare TR%, |Δ|% and RelVol for each bucket against the All sessions row, the direct check of the classic reads.
- Post-expiration window: optional shading for the sessions after each expiry, when expiring hedges unwind.
Expiration Effects Settings
- Monthly OpEx (3rd Friday), Emphasize quarterly witching, VIX expiry (Wednesday) and Shade OpEx week (all on) plus Shade post-expiration window (off): the calendar layers.
- Pre-expiration window (sessions) (default 5) and Post-expiration window (sessions) (default 5): sessions pooled into each bucket.
- Relative-volume baseline (sessions) (default 20): the average each session's volume is divided by.
- Show dashboard, Upcoming expirations and Session statistics (all on) with Position (Top Right) and Size (Small); Event labels (on) and Shading transparency (default 88).
Frequently Asked Questions

Original indicatorBuilt in-house by LuxAlgo
The Library is free. Quant makes it yours.
Pull any concept or indicator into Quant: rebuild it, retune it, or turn it into a backtested strategy of your own.