Fibonacci Pivots
 By LuxAlgoFeb 21, 2026
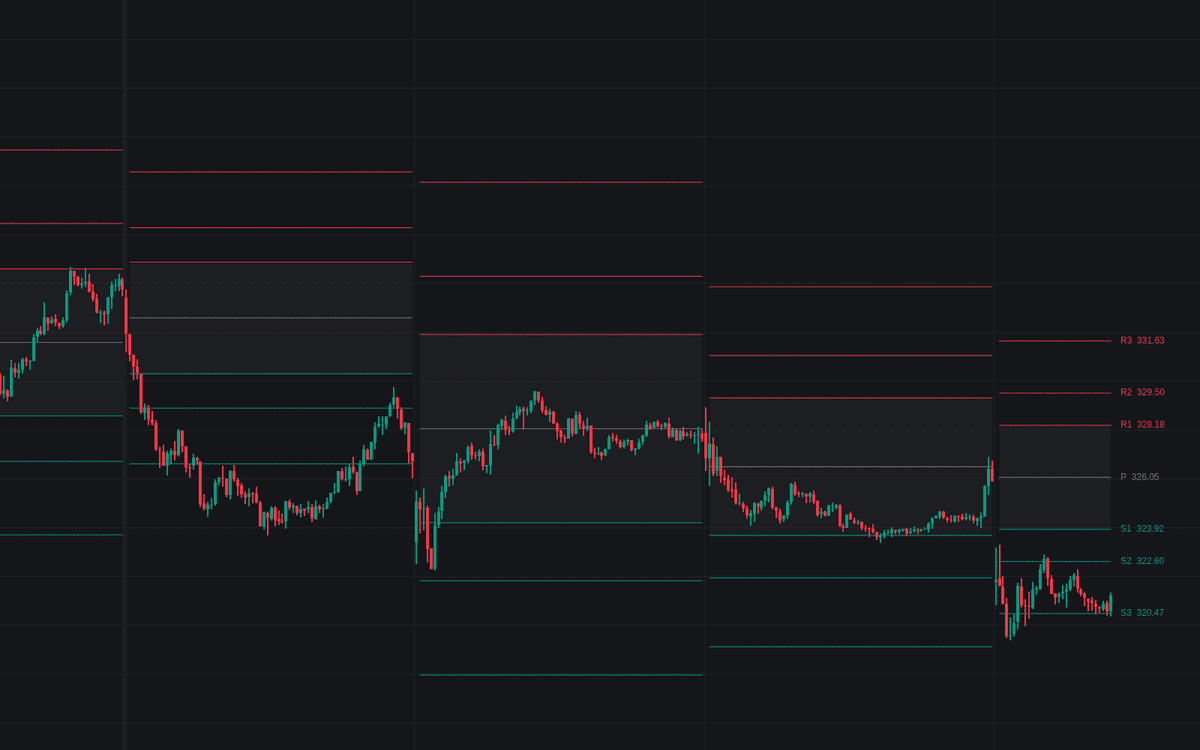

Fibonacci Pivots is the definitive clean build of Fibonacci pivots: a level ladder computed once from the prior completed period and held fixed until the next roll. The central pivot is the floor-trader average (H + L + C) / 3; each satellite sits a fixed Fibonacci fraction of the prior high-to-low range above and below it, so spacing expands and contracts with the prior period's travel. Nothing that prints today moves today's levels.
How to Trade the Fibonacci Pivots?
- P as the session lean: trade holding above the pivot is commonly read as bullish, below as bearish; crosses of P fire alerts both ways.
- R1 / S1 (0.382): the first tiers where stalls or reactions tend to appear after a directional open.
- R2 / S2 (0.618): objectives on stronger trending sessions, each with its own cross alert.
- R3 / S3 (1.000): a full prior range from the pivot. Reaching one marks an unusually directional session.
- Rotation zone: rotational sessions tend to live inside the shaded R1–S1 band, while trend days take tier after tier in sequence, a built-in day-type read.
Fibonacci Pivots Settings
- Anchor Period (default Daily): the completed prior period supplying the high, low and close, with Weekly and Monthly available. Pick a period a step senior to the chart you trade from.
- Pivot (P), R1 / S1 (0.382), R2 / S2 (0.618), R3 / S3 (1.000) (all default on): the standard ladder's visibility toggles.
- R0 / S0 (0.236) and R4 / S4 (1.382) (both default off): optional inner and outer rungs, drawn faded so the standard set stays prominent.
- R1 - S1 Rotation Zone (default on): shades the band between the first tiers.
- Level Labels (default on) and Line Width (default 1) cover presentation.
Frequently Asked Questions

Original indicatorBuilt in-house by LuxAlgo
The Library is free. Quant makes it yours.
Pull any concept or indicator into Quant: rebuild it, retune it, or turn it into a backtested strategy of your own.