Concept
Fibonacci Pivots
Fibonacci Pivots are Support/Resistance & Levels concepts. The Library holds 1 implementation, a working definition you can pull into Quant.
Top Fibonacci Pivots indicator
The top custom implementation, built on the original standard Fibonacci Pivots formula.
1 total
The Fibonacci Pivots implementation below can become a backtested trading strategy — describe your rules and Quant writes the code.
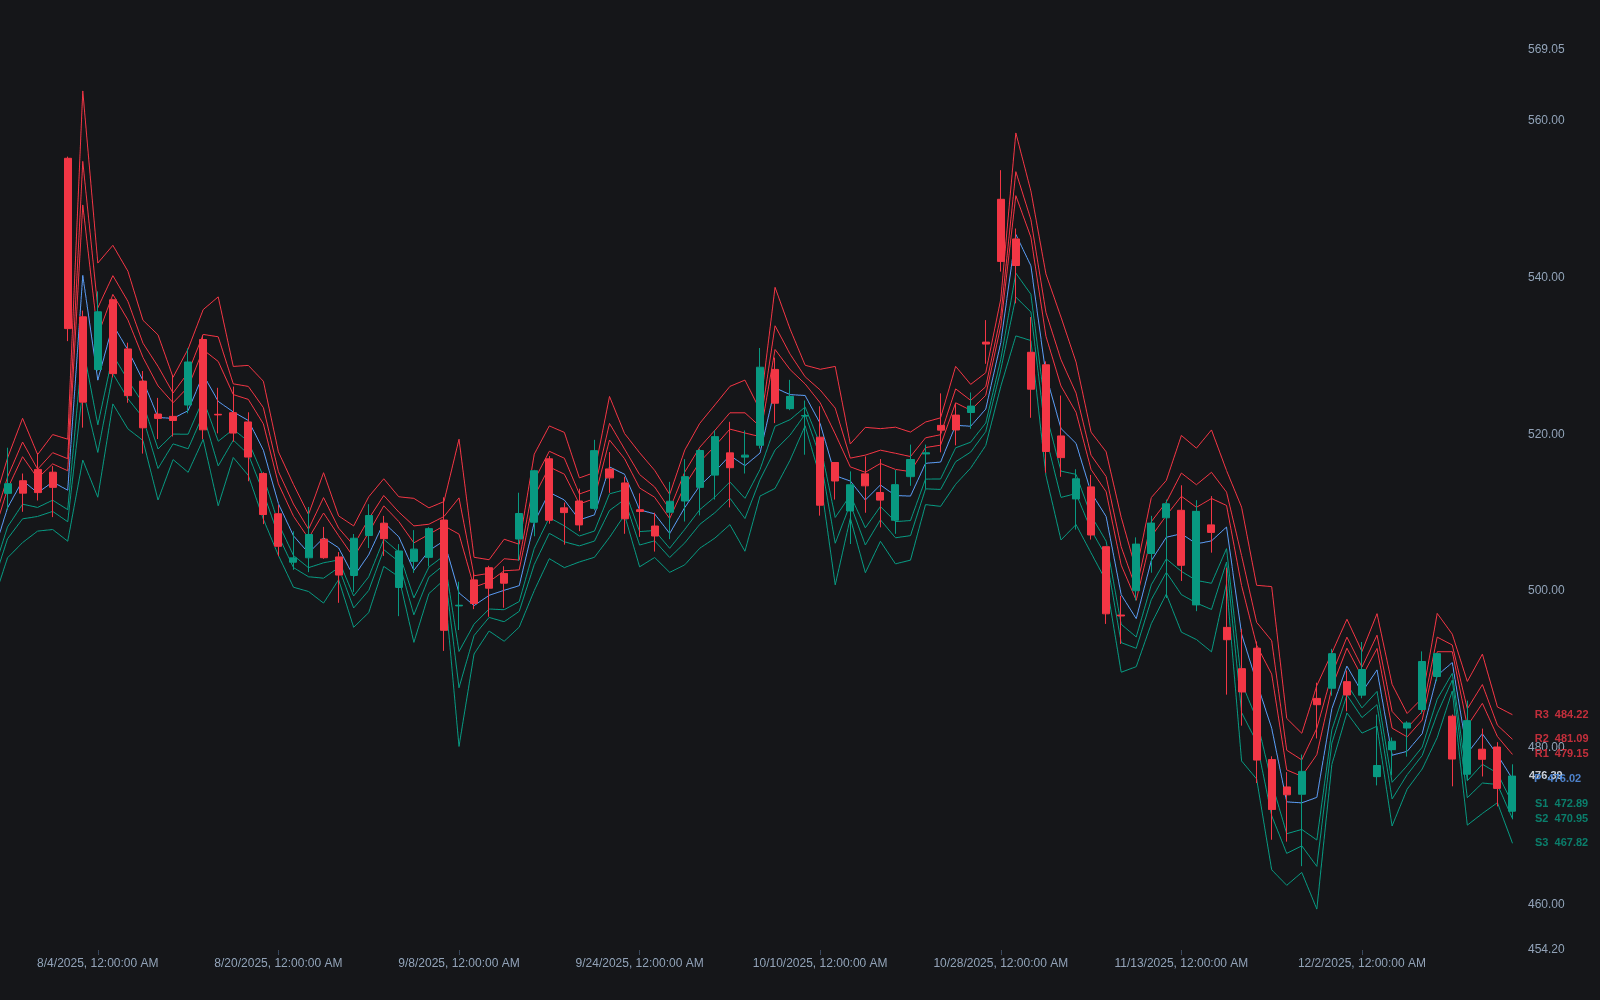
What are Fibonacci Pivots?
Fibonacci pivots are a pivot-point family that spaces support and resistance at Fibonacci ratios of the prior period's range. The central pivot is the classic (high + low + close) / 3 of the previous day, week, or month. Resistance and support levels then sit above and below it at fixed fractions of that period's high-to-low range: R1 and S1 at 38.2%, R2 and S2 at 61.8%, R3 and S3 at 100%.
The family tree starts on the exchange floor: the central pivot formula is the floor traders' pre-computed reference from the pre-screen era, and the Fibonacci variant arrived with retail charting platforms, which swapped the floor arithmetic for ratio offsets as Fibonacci vocabulary went mainstream. The variant's popularity is largely ecological, shipped as a standard option everywhere pivots are offered, which itself feeds the shared-reference effect pivots rely on.
The construction borrows its center from floor pivots and swaps the floor traders' arithmetic for proportional offsets, so level spacing scales with how far the prior period actually traveled: a quiet day yields tight pivots, a wide day distant ones. Like every pivot family, the levels are computed once at the period boundary and stay fixed all period, which makes them objective and easy to reproduce. That is also the honest core of their appeal: enough participants plot the same lines that reactions near them are worth watching, though no formula makes a level hold on any given test.
In 24-hour markets the inputs are a convention choice: which 'day' supplies the high, low, and close depends on the session template (exchange close, UTC midnight, or a chosen session), and two platforms with different templates print different pivots from identical data. Reading-wise, the levels behave like every formula ladder, bias around the central pivot, first reactions at R1/S1, trend days walking to the outer tiers, and they earn extra weight only through confluence with independently derived references.
How to calculate Fibonacci Pivots
The inputs are just the prior period's high, low, and close; everything else is arithmetic.
- 1Take the previous period's high (H), low (L), and close (C): the prior day for intraday use, the prior week or month for higher-timeframe maps.
- 2Compute the central pivot, P = (H + L + C) / 3, and the range, H - L.
- 3Project the levels: R1/S1 = P ± 0.382 × range, R2/S2 = P ± 0.618 × range, R3/S3 = P ± 1.000 × range. Some implementations add tiers such as 0.236 or 1.382.
- 4Plot the set across the new period and leave it fixed; recalculate only when the next period opens.
- 5In 24-hour markets, fix the session template first: the same data under different day boundaries yields different pivots, so consistency is the entire game.
How it's calculated
Horizontal support and resistance levels for the current period, offset from a central pivot by Fibonacci fractions of the prior period's range.
Identical to Classic floor pivots except that the offsets are Fibonacci fractions of R rather than pivot-based arithmetic.
Some platforms extend the ladder with 0.786 or 1.382 multiples (R4/S4).
On 24-hour markets the values depend on which session close is used (exchange, UTC, or broker time).
How traders use it
- As an intraday level map: daily-derived R1 and S1 mark the first zones to watch for stalls or reactions, with R2/R3 and S2/S3 serving as objectives on stronger trending days.
- As a bias line: trade holding above the central pivot is commonly read as a bullish session lean and below as bearish, the same convention used across pivot families.
- For confluence: a Fibonacci pivot gains weight when it overlaps a prior period high or low, a fib retracement of a live swing, or a session VWAP.
- On higher timeframes: weekly and monthly Fibonacci pivots give swing traders fixed references that keep their placement for the whole period.
- For day-shape framing: rotational sessions tend to live between R1 and S1 while trend days walk the ladder tier by tier, so which levels are being reached and held doubles as a day-type read, managed under standard level interaction rules.
Fibonacci Pivots vs other pivot and Fibonacci levels
Floor Pivots: Both share the (H + L + C) / 3 central pivot. Floor pivots build satellites from arithmetic like 2P - L and 2P - H, so spacing is asymmetric; Fibonacci pivots offset by fixed fractions of the range, symmetric around the pivot.
Camarilla: Camarilla levels derive from the prior close plus small fractions of the range, sit much closer to price, and center on fading the inner levels; Fibonacci pivots spread proportionally wider around a central pivot.
Fib Retracement: A retracement is anchored by hand to a chosen swing and measures inside it. Fibonacci pivots involve no discretion: they derive mechanically from the prior period's high, low, and close.
Concept family
Support/Resistance & Levels
38 concepts mapped · 38 in the Library
Fibonacci Pivots FAQ
Turn Fibonacci Pivots into a trading strategy.
Take the implementation from this page into Quant, then build on it, backtest it on real data, and keep refining it in conversation.