Concept
Floor Pivots
Floor Pivots, also known as classic pivots, P, S1–S3, R1–R3, daily/weekly/monthly/yearly sets, pivot confluence, are Support/Resistance & Levels concepts. The Library holds 1 implementation, a working definition you can pull into Quant.
Top Floor Pivots indicator
The top custom implementation, built on the original standard Floor Pivots formula.
1 total
Want to trade Floor Pivots? The implementation below is one prompt away from a backtested strategy in Quant.
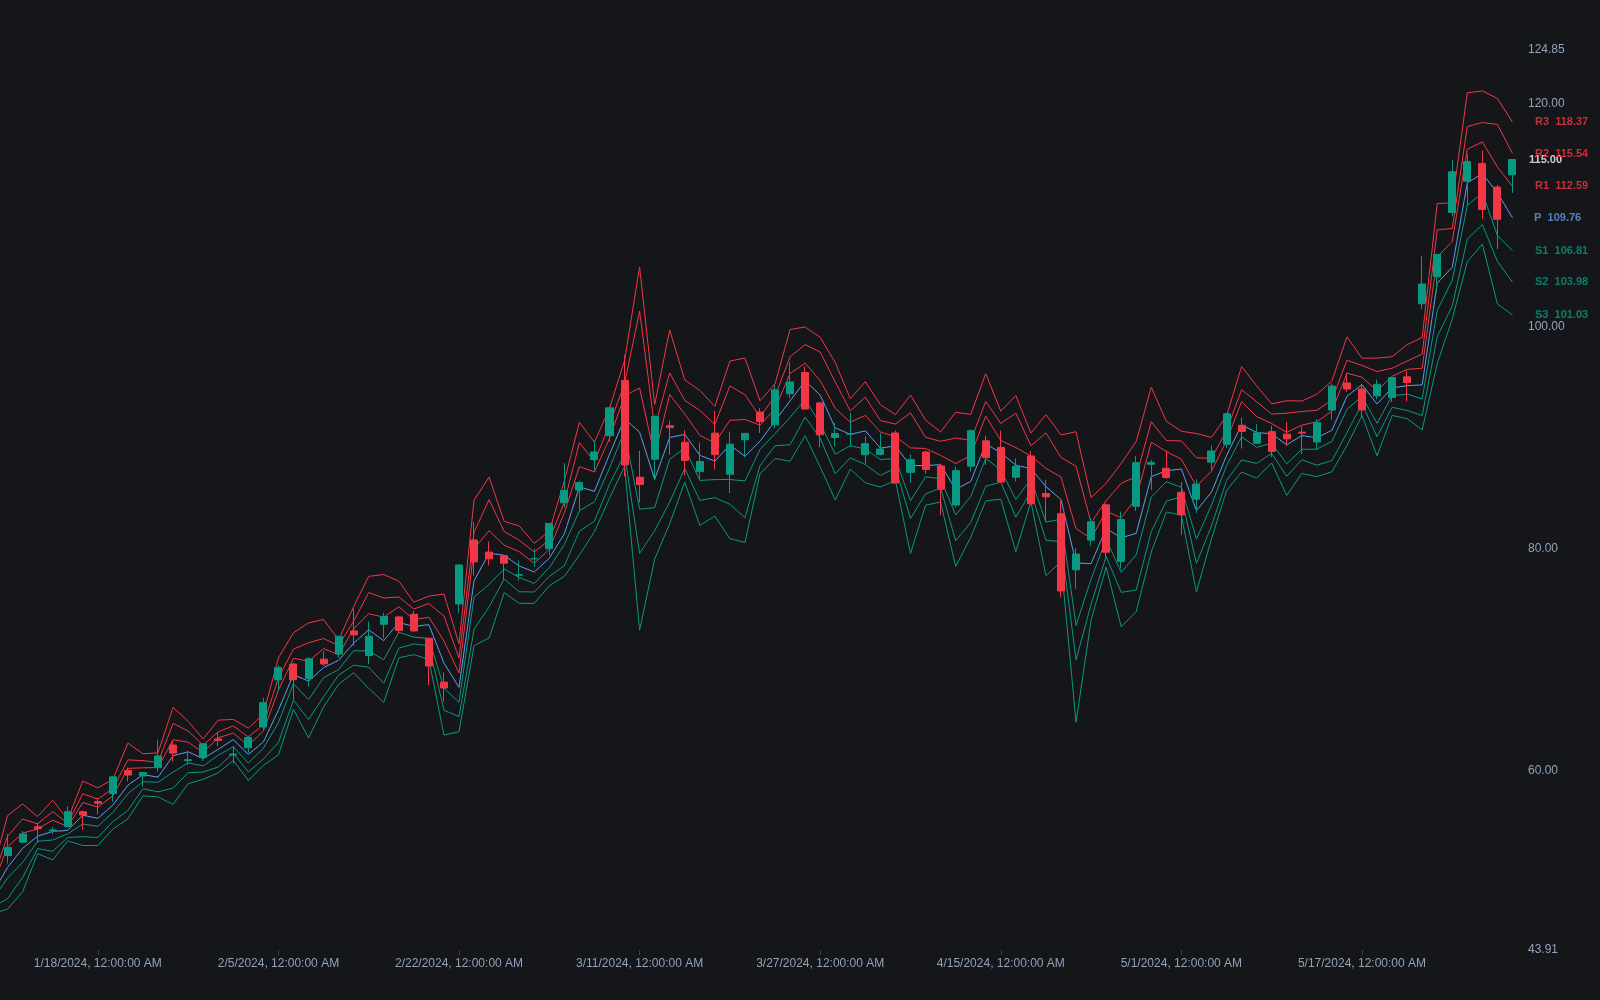
What are Floor Pivots?
Floor pivots, also called classic or traditional pivot points, are a ladder of intraday reference levels computed from the high, low, and close of the prior period. The central pivot P is the average of those three prices, and paired resistance and support levels (R1 through R3, S1 through S3) fan out around it. The name comes from the futures pits: floor traders needed reference levels they could compute from yesterday's figures before the open, with no chart at hand.
The common construction: P equals (high + low + close) / 3. R1 reflects the prior low through the pivot (2P - L) and S1 reflects the prior high (2P - H), while R2 and S2 sit one full prior range above and below P. Third-tier formulas vary by source, so two platforms can disagree on R3 and S3 while matching everywhere else. Sibling families (Camarilla, Woodie, Fibonacci pivots, the Central Pivot Range) keep the same inputs but change the arithmetic.
Their appeal is speed and coordination. The whole ladder exists before the session opens, so entries, stops, and targets can be planned in advance, and because many participants compute identical numbers, reactions at P, R1, and S1 are often visible even where the chart shows no other nearby structure. They are reference prices, not predictions: on a strong trend day price can march through the entire ladder, and the pivots' value then is in showing that this is happening, not in stopping it.
How to calculate floor pivots
Everything derives from three numbers, so the real decision is which session's numbers to feed in.
- 1Take the completed prior period's high, low, and close: the prior day for intraday sets, the prior week, month, or year for higher sets.
- 2Settle the data convention before computing. RTH versus ETH changes the high and low on futures, and 24-hour markets need an explicit day boundary for the close; mismatched conventions are the usual reason two charts disagree.
- 3Compute the ladder: P = (H + L + C) / 3, then R1 = 2P - L, S1 = 2P - H, R2 = P + (H - L), S2 = P - (H - L), extending to R3 and S3 with your platform's variant.
- 4Roll the set at each period boundary and leave it fixed until the next roll: nothing that prints today changes today's pivots.
How it's calculated
A central pivot with three resistance and three support levels for the current period, projected from the prior period's high, low, and close.
R3 and S3 formulas vary by source; a common alternative is R3 = P + 2 × (H_p - L_p) and S3 = P - 2 × (H_p - L_p).
On 24-hour markets the session close used (exchange settlement, 5 pm New York, or UTC midnight) shifts every level.
Woodie, Camarilla, and Fibonacci pivots keep the same inputs but change the weightings.
How traders use it
- As a mean-reversion frame on rotational days: fading pushes into S1 or R1 back toward P, on the read that a trading range session tends to oscillate around the central pivot.
- As a bias line: holding above P with P defended on dips keeps a long-leaning read, acceptance below flips it, and a one-sided open beyond R1 or S1 warns range traders to stop fading and consider following.
- As a pre-planned ladder for exits and risk: entries at one rung commonly target the next (long at S1, first target P, stretch target R1), fixing the reward-to-risk arithmetic before the session begins.
- As confluence material: a daily level landing on a weekly pivot, a prior extreme, or the session VWAP draws far more attention than any single line, and confluence scoring formalizes exactly that stacking.
Floor Pivots vs other pivot families
Camarilla: Camarilla anchors its ladder to the prior close rather than a computed pivot and spaces tiers at fixed fractions of the prior range, with a more prescriptive playbook: fade the H3/L3 ring, trade breaks through H4/L4.
Fibonacci Pivots: Fibonacci pivots keep the same central P but place supports and resistances at Fibonacci ratios of the prior range (commonly 38.2% and 61.8%) instead of reflecting the raw high and low.
Woodie Pivots: Woodie pivots reweight the pivot itself, doubling the close (some versions substitute the current open), so the center leans toward the most recent price rather than the plain three-way average.
Central Pivot Range: The Central Pivot Range keeps the floor-pivot P but flanks it with top and bottom central levels built from the high-low midpoint, producing a band whose width practitioners read as a clue to the coming session's character.
Concept family
Support/Resistance & Levels
38 concepts mapped · 38 in the Library
Floor Pivots FAQ
Turn Floor Pivots into a trading strategy.
Take the implementation from this page into Quant, then build on it, backtest it on real data, and keep refining it in conversation.