


Gann Square of 9 Vibration Levels
 by LuxAlgo · Feb 16, 2026
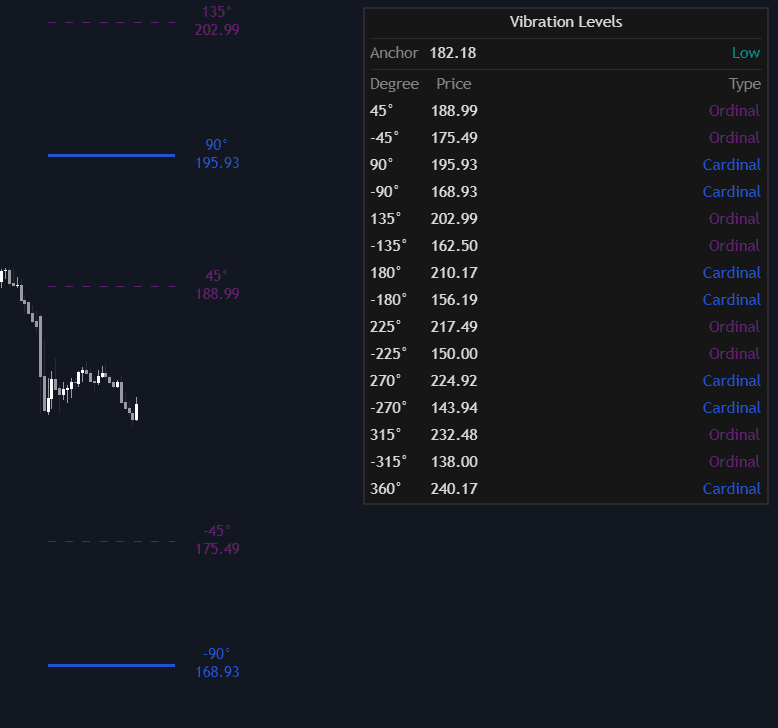
The Gann Square of 9 Vibration Levels indicator is a price action trading indicator designed to project mathematically derived support and resistance levels using W.D. Gann’s Square of 9 methodology. By converting angular degrees into price levels, this tool helps traders anticipate potential reversal zones, breakout levels, and price targets with a structured, rule-based trading strategy.
How to Trade the Gann Square of 9 Vibration Levels Indicator?
This trading indicator calculates price “vibrations” from a selected anchor point using angular relationships such as 45°, 90°, 180°, and 360°. In Gann theory, these angles represent harmonic relationships where price is statistically more likely to pause, react, or reverse.
The core idea is simple:
When price approaches a key angular level derived from the Square of 9, it may encounter support, resistance, or a volatility expansion zone.
There are two primary anchoring methods:
-
Auto Pivot Mode:
Automatically detects recent swing highs or swing lows using a customizable lookback period.- If a new swing low is detected, upward vibration levels are projected.
- If a new swing high is detected, downward vibration levels are calculated.
This dynamic approach is ideal for traders who want adaptive support and resistance aligned with current market structure.
-
Manual Anchor Mode:
Allows traders to define a specific price as the Square of 9 center point.
This is useful for anchoring to:- Major swing highs or lows
- Yearly or monthly opens
- Significant breakout levels
- Institutional reference prices
Using Cardinal and Ordinal Levels in Your Trading Strategy
The indicator separates vibration levels into two categories, allowing for structured decision-making:
Cardinal Levels (90°, 180°, 270°, 360°)
These levels form the “cross” within the Square of 9 and are traditionally viewed as the strongest vibration points.
- Displayed as solid lines
- Often act as major support or resistance
- Frequently align with exhaustion or strong breakout zones
- Suitable for primary take-profit or reversal setups
Cardinal levels are often treated as higher-probability inflection zones in a trend-following or mean-reversion trading strategy.
Ordinal Levels (45°, 135°, 225°, 315°)
These represent the “corners” of the Square of 9.
- Displayed as dashed lines
- Provide intermediate reaction zones
- Useful for scaling in/out of trades
- Often act as secondary support or resistance
Traders commonly use ordinal levels for tighter profit targets or intraday reaction plays.
Mathematical Foundation of the Indicator
The script uses the classical Square of 9 formula to convert angular degrees into price projections:
Price = (sqrt(Anchor) + (Degree / 180) * Direction)^2
Where:
- Anchor = Selected pivot or manual price reference
- Degree = Angular vibration level (e.g., 90°, 180°)
- Direction = Upward (+1) or downward (−1) projection
This mathematical transformation creates evenly spaced, geometry-based price levels that expand outward from the anchor. Unlike arbitrary horizontal lines, these levels are derived from structured numerical relationships rooted in Gann theory.
Advanced Use Cases for Traders
This trading indicator can be integrated into multiple trading styles:
-
Trend Trading:
Use upward projections from a confirmed swing low to identify breakout continuation targets. -
Reversal Trading:
Watch for rejection candles or momentum divergence when price reaches a major cardinal level. -
Scalping and Intraday Trading:
Combine Square of 9 levels with volume, VWAP, or order flow to refine entries and exits. -
Swing Trading:
Anchor to major weekly pivots and project forward multi-level targets.
The real-time dashboard enhances usability by displaying:
- Current anchor price
- Active degree levels
- Exact projected price values
This keeps the main chart clean while still giving precise numerical targets.
Detailed Settings Explained
Calculation Settings
-
Anchor Type:
Choose between dynamic Auto Pivot mode or a fixed Manual anchor. -
Manual Anchor Price:
The selected center point when using Manual mode. -
Pivot Lookback:
Determines how many bars are used to identify swing highs or lows in Auto mode.
Shorter lookbacks = more reactive levels
Longer lookbacks = more structural levels -
Vibration Direction:
Project levels:- Up
- Down
- Both directions
This flexibility allows traders to adapt the indicator to bullish, bearish, or ranging markets.
Visual Settings
-
Show Cardinal Levels (90°):
Toggle major cross levels on/off. -
Show Ordinal Levels (45°):
Toggle secondary corner levels on/off. -
Show Level Labels:
Displays both the angular degree and price value directly on the chart. -
Cardinal/Ordinal Color:
Customize colors for clearer visual hierarchy.
Dashboard Controls
- Dashboard: Enable or disable the on-screen data table.
- Position: Move the dashboard to any chart corner.
- Size: Adjust text and table scaling for readability.
Why Use the Gann Square of 9 as a Trading Indicator?
Unlike traditional indicators that rely solely on lagging moving averages or oscillators, the Gann Square of 9 Vibration Levels indicator provides:
- Geometry-based support and resistance
- Objective price targets
- Structured breakout zones
- A rules-based framework for market timing
By translating angular relationships into actionable price levels, traders gain a mathematically grounded edge for both risk management and trade planning.
FAQ
What is the Gann Square of 9 Vibration Levels indicator used for?
It is used to identify potential support and resistance levels, price targets, and reversal zones using Gann’s angular mathematics. Traders apply it in trend-following, breakout, and reversal trading strategies.
Is this trading indicator suitable for all markets?
Yes. It can be applied to stocks, forex, crypto, indices, and futures across multiple timeframes, from intraday charts to higher timeframes.
How do I access the Gann Square of 9 Vibration Levels indicator?
You can get access on the LuxAlgo Library for charting platforms like TradingView, MetaTrader (MT4/MT5), and NinjaTrader for free.
Trading & investing are risky and many will lose money in connection with trading and investing activities. All content on this site is not intended to, and should not be, construed as financial advice. Decisions to buy, sell, hold or trade in securities, commodities and other investments involve risk and are best made based on the advice of qualified financial professionals. Past performance does not guarantee future results.
Hypothetical or Simulated performance results have certain limitations. Unlike an actual performance record, simulated results do not represent actual trading. Also, since the trades have not been executed, the results may have under-or-over compensated for the impact, if any, of certain market factors, including, but not limited to, lack of liquidity. Simulated trading programs in general are designed with the benefit of hindsight, and are based on historical information. No representation is being made that any account will or is likely to achieve profit or losses similar to those shown.
Testimonials appearing on this website may not be representative of other clients or customers and is not a guarantee of future performance or success.
As a provider of technical analysis tools and strategies, we do not have access to the personal trading accounts or brokerage statements of our customers. As a result, we have no reason to believe our customers perform better or worse than traders as a whole based on any content, tool, or platform feature we provide.
Charts used on this site are by TradingView in which the majority of our technical indicators are built on. TradingView® is a registered trademark of TradingView, Inc. www.TradingView.com TradingView® has no affiliation with the owner, developer, or provider of the Services described herein.
Market data is provided by CBOE, CME Group, BarChart, Massive, CoinAPI. Select U.S. equities data is provided through Massive. CBOE BZX real-time U.S. equities data is licensed from CBOE and provided through BarChart. Real-time futures data is licensed from CME Group and provided through BarChart. Select cryptocurrency data, including major coins, is provided through CoinAPI. All data is provided “as is” and should be verified independently for trading purposes.
This does not represent our full Disclaimer. Please read our full disclaimer.
© 2026 LuxAlgo Global, LLC.