


Gap Fill Breakouts
 by LuxAlgo · Jun 12, 2026
The Gap Fill Breakouts indicator provides a sophisticated way to identify Fair Value Gaps and track structural support or resistance levels for precise trading entries. By filtering gaps based on ATR volatility and highlighting breakout opportunities near these zones, this tool enables traders to visualize market efficiency and potential price action shifts effectively.
Usage
The Gap Fill Breakouts indicator is designed to streamline technical analysis by automatically plotting Fair Value Gaps (FVG) that meet specific volatility criteria.
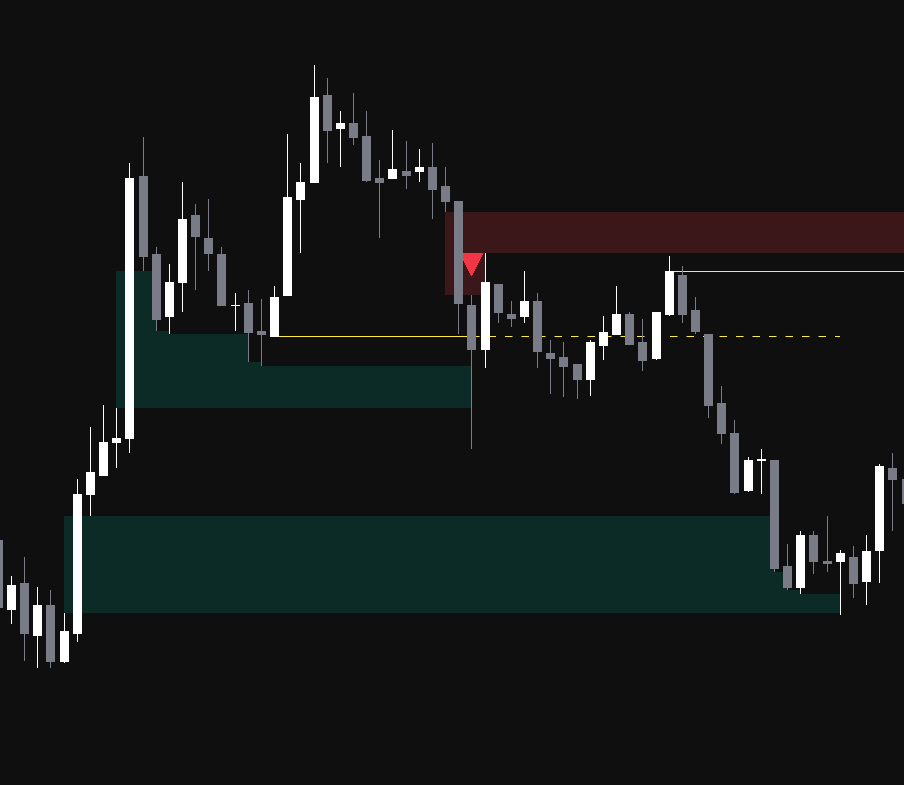
- Identifying Gaps: When a significant gap in price action is detected, the indicator draws a box on the chart. These boxes act as potential zones of interest. As price interacts with these gaps, the script utilizes an adaptive stair step mechanism to shrink the box, effectively showing the remaining unfilled portion of the gap.
- Trading Breakouts: The indicator identifies structural pivot points near these gaps. When price breaks through a established support or resistance level associated with an active FVG, the indicator displays a signal arrow. Bullish breakouts are marked with a green upward triangle, while bearish breakouts are marked with a red downward triangle.
- Strategic Filtering: Use the ATR Multiplier to define what constitutes a valid gap. A higher value will filter out smaller, less significant price imbalances, focusing your chart on high momentum gaps only.
Details
The script is built using advanced Pine Script object oriented programming to manage multiple gap states simultaneously. It monitors market structure by calculating pivot highs and lows relative to the identified Fair Value Gaps.
The core logic revolves around the concept of mitigation. Unlike static support and resistance tools, this indicator constantly updates the boundaries of the FVG boxes as price enters them. This ensures that the trader is always looking at the most relevant remaining liquidity zone. By combining this with pivot detection, the script provides a confluence based signal that triggers only when price clears a proven structural level within the vicinity of a market imbalance.
Settings
Detection Parameters
- ATR Multiplier for FVG Size: Sets the minimum size requirement for a gap to be considered valid, expressed as a multiple of the Average True Range.
- Pivot Length: Determines the number of bars used to detect structural support and resistance levels. A higher value leads to more significant, but less frequent, pivot levels.
- Max Bars Back for Signal: Defines the maximum age of an FVG in bars. If a breakout occurs after the gap has aged past this setting, a signal will not be generated.
- Number of Gaps Shown: Controls the maximum number of active FVG boxes displayed on the chart to keep your workspace clean.
Style
- Bullish/Bearish FVG Color: Customizes the visual appearance of the detected liquidity gaps.
- Support/Resistance Line Color: Adjusts the color of the lines identifying key structural levels.
Alerts
- Bullish/Bearish Breakout Alerts: Toggles the availability of real time notifications when price breaches an FVG-related support or resistance level.
FAQ
What is the primary purpose of this tool?
This tool helps traders isolate price imbalances (FVGs) and identify breakout signals when price interacts with structural pivots near those imbalances.
How does the adaptive mitigation work?
The script automatically updates the box boundaries as price moves into the gap area, ensuring the visual representation always reflects the remaining unfilled space.
How can I access Gap Fill Breakouts?
You can get access on the LuxAlgo Library for charting platforms like TradingView, MetaTrader (MT4/MT5), and NinjaTrader for free.
Trading & investing are risky and many will lose money in connection with trading and investing activities. All content on this site is not intended to, and should not be, construed as financial advice. Decisions to buy, sell, hold or trade in securities, commodities and other investments involve risk and are best made based on the advice of qualified financial professionals. Past performance does not guarantee future results.
Hypothetical or Simulated performance results have certain limitations. Unlike an actual performance record, simulated results do not represent actual trading. Also, since the trades have not been executed, the results may have under-or-over compensated for the impact, if any, of certain market factors, including, but not limited to, lack of liquidity. Simulated trading programs in general are designed with the benefit of hindsight, and are based on historical information. No representation is being made that any account will or is likely to achieve profit or losses similar to those shown.
Testimonials appearing on this website may not be representative of other clients or customers and is not a guarantee of future performance or success.
As a provider of technical analysis tools and strategies, we do not have access to the personal trading accounts or brokerage statements of our customers. As a result, we have no reason to believe our customers perform better or worse than traders as a whole based on any content, tool, or platform feature we provide.
Charts used on this site are by TradingView in which the majority of our technical indicators are built on. TradingView® is a registered trademark of TradingView, Inc. www.TradingView.com TradingView® has no affiliation with the owner, developer, or provider of the Services described herein.
Market data is provided by CBOE, CME Group, BarChart, Massive, CoinAPI. Select U.S. equities data is provided through Massive. CBOE BZX real-time U.S. equities data is licensed from CBOE and provided through BarChart. Real-time futures data is licensed from CME Group and provided through BarChart. Select cryptocurrency data, including major coins, is provided through CoinAPI. All data is provided “as is” and should be verified independently for trading purposes.
This does not represent our full Disclaimer. Please read our full disclaimer.
© 2026 LuxAlgo Global, LLC.