Gap-volatility Relation
 By LuxAlgoMay 2, 2026
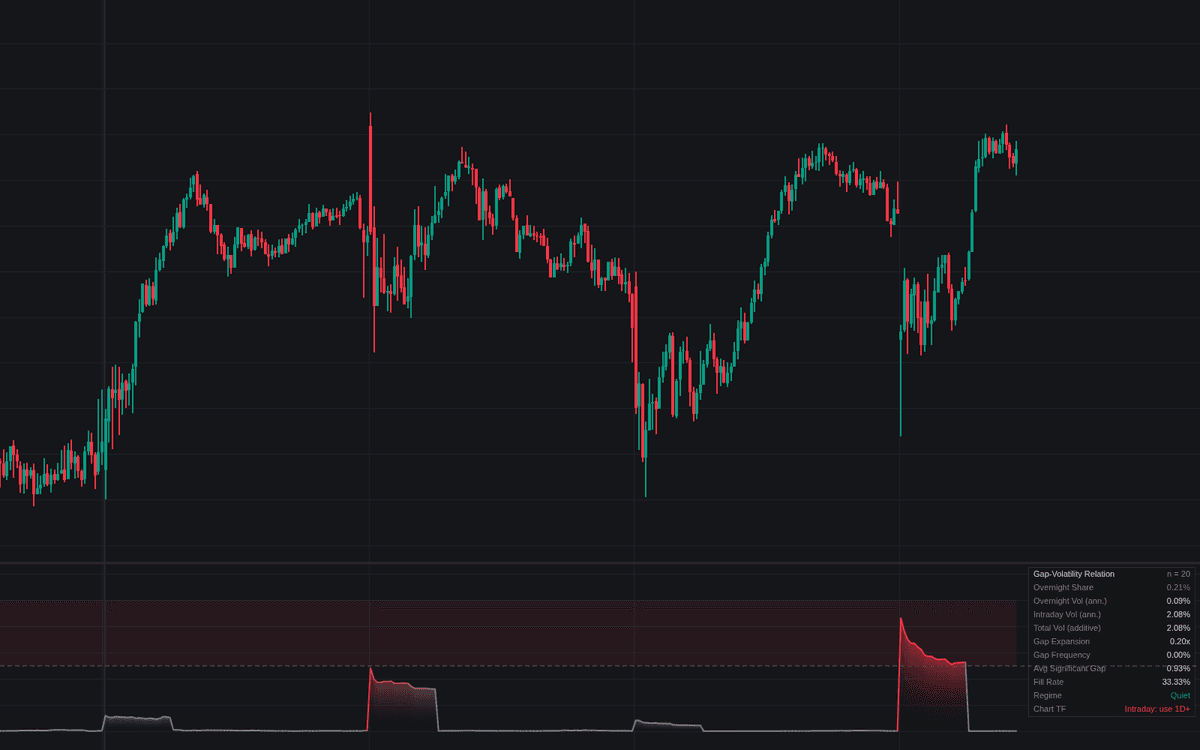

Gap-volatility Relation splits total variance into overnight and intraday components and plots the overnight share as a percentage, the gap-volatility relation turned into a chartable tool for the first time. The Overnight Variance Share line runs against a dashed High Share Threshold, and a dashboard adds component volatilities, gap expansion, frequency, fill rate and a regime read.
How to Trade the Gap-volatility Relation?
- Share above the threshold: gaps carry more variance than the sessions between them; range-based estimates understate risk and overnight exposure deserves scaling, with alerts both ways.
- Stressed regime: short-run gaps at 1.5x their baseline or more while recent significant gaps mostly go unfilled. Escalation, with a dedicated alert.
- Quiet regime: a gap expansion ratio at or below 0.75 marks contracted gaps.
- Large Opening Gap alert: a significant gap at least twice the baseline mean absolute gap.
Built for daily and higher charts; the dashboard warns when run intraday.
Gap-volatility Relation Settings
- Estimation Window (default 20): sessions behind the two sample variances; longer windows steady the share but react slower.
- Periods Per Year (default 252): annualization for the volatility readouts.
- High Share Threshold % (default 50): the dashed reference where gaps dominate.
- Minimum Gap Size % (default 0.2), Fill Window (Sessions) (default 1) and Gap Sample Size (default 10): the significant-gap definition and its statistics.
- Short Gap Window (default 10), Baseline Gap Window (default 63), Expansion Ratio (default 1.5), Contraction Ratio (default 0.75), Unfilled Threshold % (default 50) and Large Gap Multiple (default 2): regime and alert triggers.
- Show Dashboard (default enabled) plus toggles for component volatilities, gap marks and the regime highlight (all default disabled).
Frequently Asked Questions

Original indicatorBuilt in-house by LuxAlgo
The Library is free. Quant makes it yours.
Pull any concept or indicator into Quant: rebuild it, retune it, or turn it into a backtested strategy of your own.