GARCH-family Clustering
 By LuxAlgoFeb 21, 2026
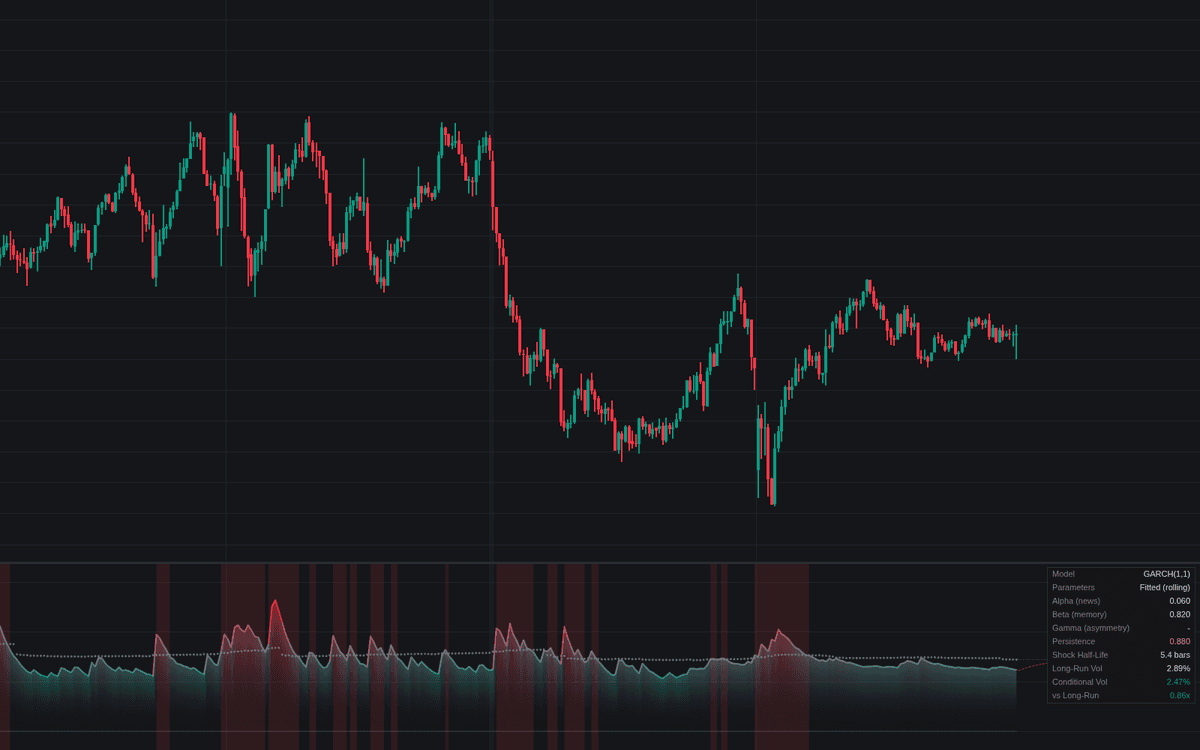

GARCH-family Clustering runs GARCH(1,1), GJR-GARCH(1,1) or EGARCH(1,1) in a pane, plotting conditional volatility with its long-run anchor, a mean-reverting forecast path and the active coefficients. The recursions, variance-targeting anchor and quasi-MLE grid fit follow the published GARCH-family clustering models; GJR and EGARCH add the leverage effect where sell-offs expand volatility more than rallies.
How to Trade the GARCH-family Clustering?
- Stressed regime: conditional volatility crossing above the long-run anchor (alertable) opens a phase where elevated volatility tends to persist. Widen stops, trim size.
- Calm regime: decay back below the anchor restores compression conditions.
- Volatility shocks: a return beyond the sigma threshold marks the surprises whose aftermath the persistence term stretches out.
- Forecast path: the dotted projection decays toward the anchor at the persistence rate, a horizon read for sizing decisions.
GARCH-family Clustering Settings
- Model (default GARCH(1,1)): the symmetric workhorse, or GJR / EGARCH for leverage effects.
- Source (default close) and Window Length (default 250): the sample behind the anchor and the fit.
- Annualize (default enabled) with Bars Per Year (default 252): comparability across instruments.
- Parameters (default Fitted (rolling quasi-MLE grid)) with Refit Every (bars) (500); Alpha - News (0.10), Beta - Persistence (0.85) and Gamma - Asymmetry (0.05) drive Manual mode and seed the recursion until the first fit.
- Show Forecast (on) with Horizon (20); EWMA Benchmark (off) with Lambda (0.94); Shock Threshold (sigmas) (2.0) and Mark Shocks (off).
- Show Dashboard (on); Regime Shading (default Stressed), colors and Gradient Fill are style options.
Frequently Asked Questions

Original indicatorBuilt in-house by LuxAlgo
The Library is free. Quant makes it yours.
Pull any concept or indicator into Quant: rebuild it, retune it, or turn it into a backtested strategy of your own.