Garman-Klass Estimator
 By LuxAlgoJun 16, 2026
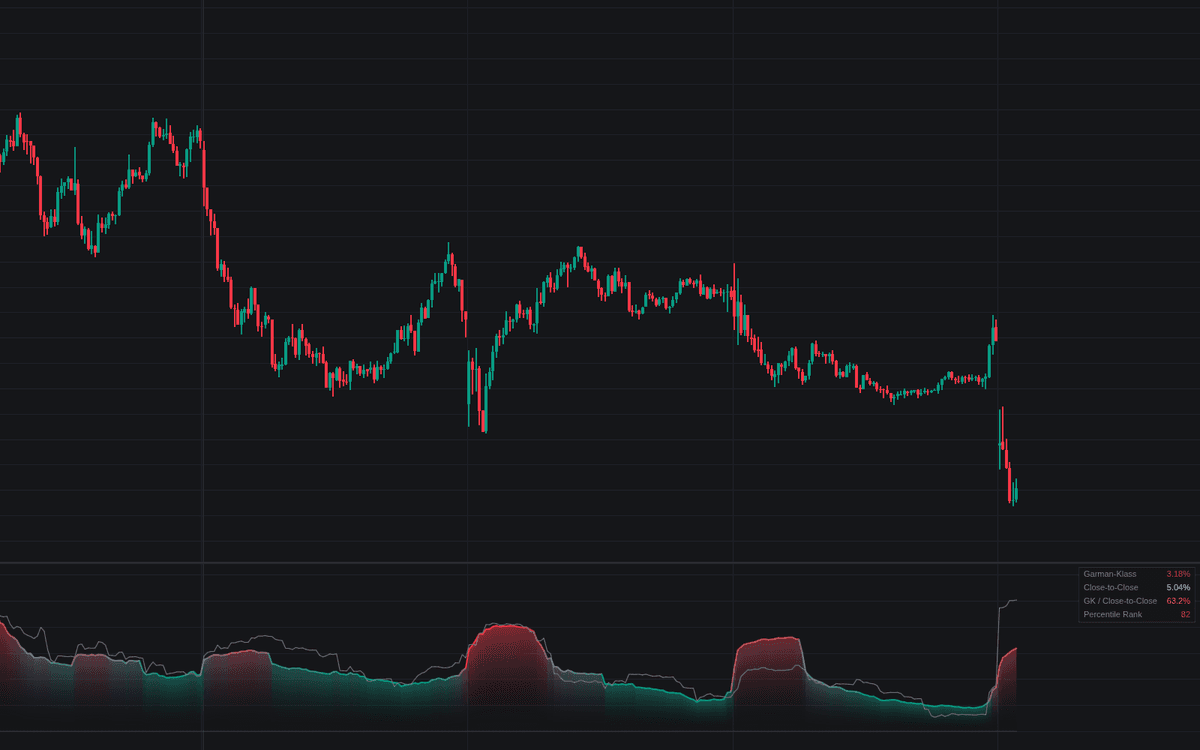

Garman-Klass Estimator measures volatility from the whole bar rather than closes alone: each bar contributes half the squared log high/low range minus (2 ln 2 − 1) times the squared open-to-close move, and the window average is annualized into the line. It is a faithful build of the Garman-Klass estimator, with a close-to-close line on identical settings so the blind spot and the efficiency edge are both visible.
How to Trade the Garman-Klass Estimator?
- Compression: the percentile rank crossing under the low threshold flags a quiet stretch, a rank-based squeeze screen for lulls that often resolve into wider movement.
- Expansion: the rank crossing the high threshold confirms volatility is broadening.
- Gap Blind Spot: Garman-Klass far below close-to-close says the action is happening between sessions, in gaps it never samples. Trust the pair, not the level.
- Session Churn: the estimate far above close-to-close flags heavy intrabar trade that the closing prints barely register.
Garman-Klass Estimator Settings
- Window Length (default 20): bars the per-bar variance is averaged over; the estimator's efficiency makes 10–30-bar windows usable where close-to-close is still noisy.
- Annualize (default enabled) with Bars Per Year (default 252): scales readings to annualized percent. Match the constant when reconciling with other tools.
- Close-to-Close Comparison (default enabled): the same-window benchmark line.
- Divergence Alert Level % (default 25): how far the two lines must diverge before the diagnostic alerts fire.
- Percentile Lookback (default 100) with High Percentile (80) and Low Percentile (20); Show Percentile Levels (default disabled) plots the thresholds as dotted levels.
- Show Dashboard (default enabled); line colors and Gradient Fill are cosmetic.
Frequently Asked Questions

Original indicatorBuilt in-house by LuxAlgo
The Library is free. Quant makes it yours.
Pull any concept or indicator into Quant: rebuild it, retune it, or turn it into a backtested strategy of your own.