Parkinson Estimator
 By LuxAlgoApr 11, 2026
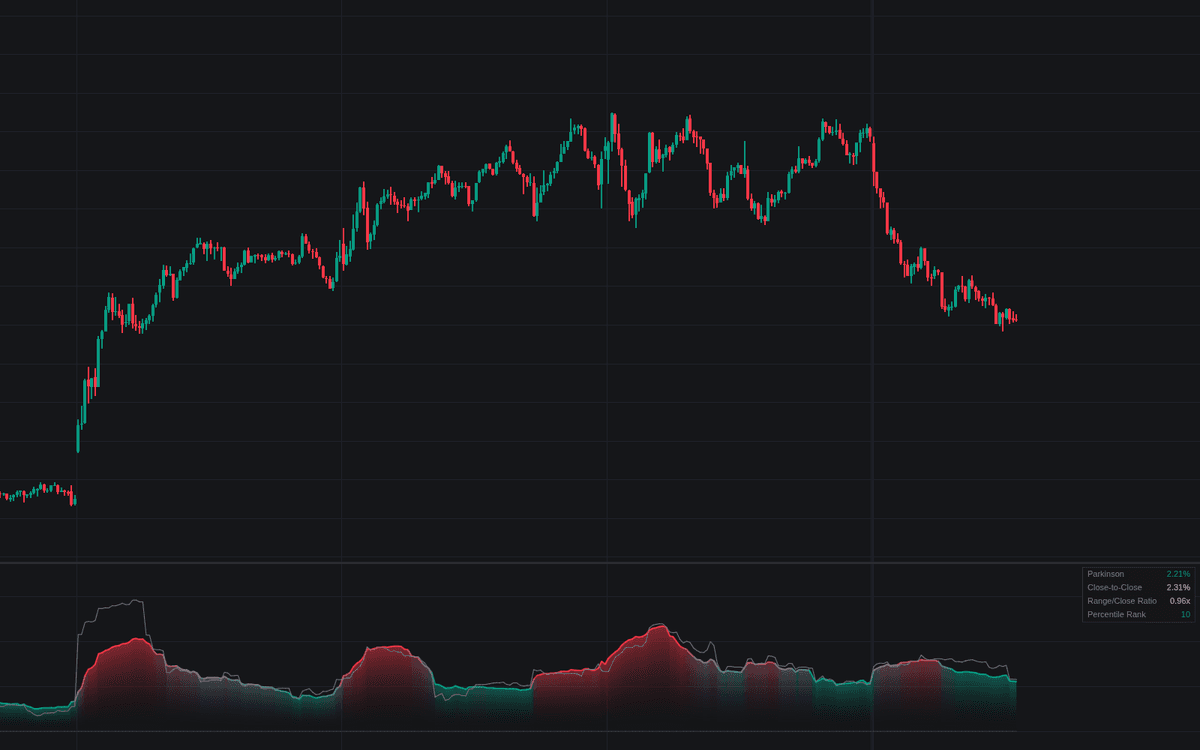

Parkinson Estimator computes volatility from the high-low span using the Parkinson estimator: each bar's log range enters squared and scaled, the window averages those terms, and the result is annualized into a percentage. The high-low span reflects the bar's full travel, not one endpoint, so the estimate settles on short windows; the build plots close-to-close volatility beside it on identical settings, so the gap between the lines diagnoses where movement happens. Percentile thresholds rank the reading within its lookback; a dashboard reports both figures, their ratio, and rank.
How to Trade the Parkinson Estimator?
- Percentile rank crossing above 80: volatility expansion under way. Expect range and size accordingly.
- Rank crossing below 20: compression: the quiet stretches that often precede range expansion.
- Parkinson below close-to-close: overnight gaps are doing the moving, risk the intraday span never records.
- Parkinson above close-to-close: sessions are churny and wide-ranged even where the closes land quietly.
The reading is non-directional; alerts cover both percentile crossings and both line crossings.
Parkinson Estimator Settings
- Window Length (default 20): bars averaged; hold it constant when comparing instruments.
- Annualize (default enabled) and Bars Per Year (default 252): on intraday charts use bars per session times trading days.
- Close-to-Close Comparison (default enabled): the one-endpoint benchmark on identical settings.
- Percentile Lookback (default 100), High Percentile (default 80), Low Percentile (default 20): the regime thresholds.
- Show Percentile Levels (default disabled): plot the threshold values as dotted references.
- Show Dashboard (default enabled); Gradient Fill (default enabled).
Frequently Asked Questions

The Library is free. Quant makes it yours.
Pull any concept or indicator into Quant: rebuild it, retune it, or turn it into a backtested strategy of your own.