Gaussian Mixture Models
 By LuxAlgoJun 1, 2026
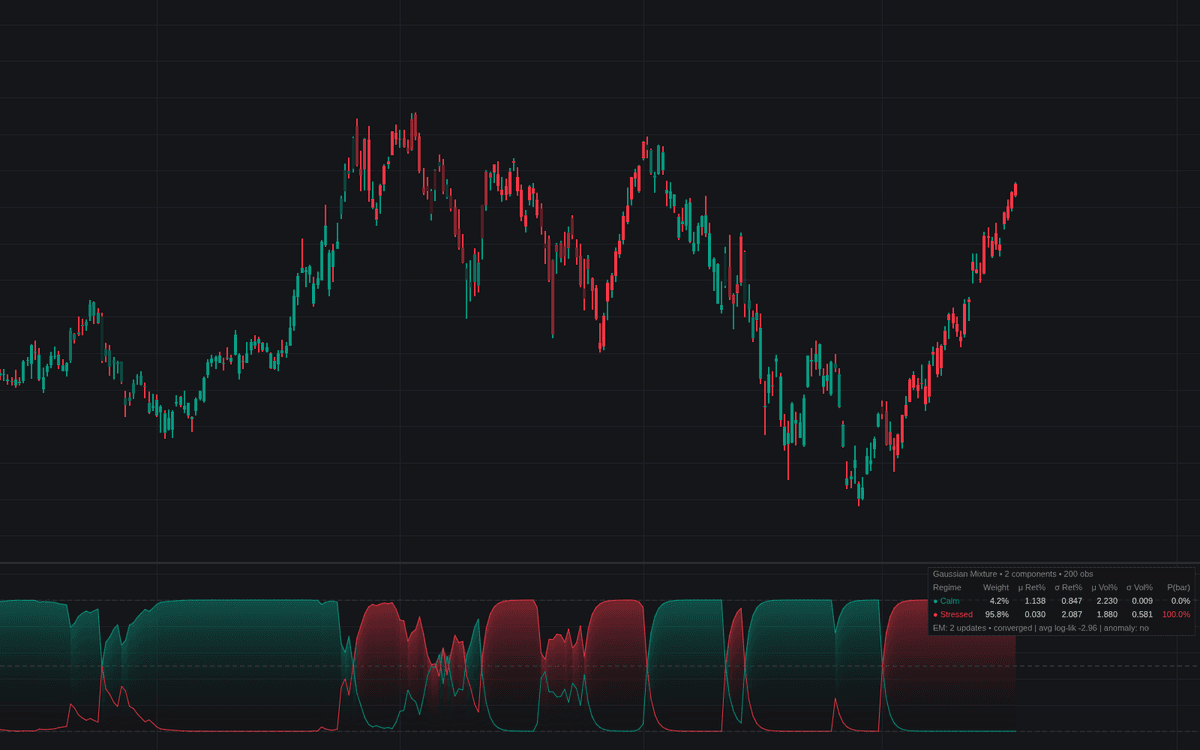

Gaussian Mixture Models fits a Gaussian mixture model to recent returns and volatility, plotting each fitted regime's probability for the current bar from 0 to 100% in a dedicated pane. Components are re-estimated by expectation-maximization over a rolling 200-observation window and ordered by variance, so the first line is always the calm regime and the last the stressed one. Candles tint by regime, opacity scaling on confidence; a dashboard reports weights, means and EM status.
How to Trade the Gaussian Mixture Models?
- Calm regime dominant: the lowest-variance component leads, the backdrop for quiet-market tactics.
- Stressed regime dominant: the highest-variance component leads. Reduce risk; it is not a directional call.
- Middling probabilities: the bar sits between regimes; wait for a confident reading.
- Low-Likelihood Anomaly alert: the bar resembles nothing in the training window. Treat labels with suspicion.
Alerts fire on each dominant-regime change; as across the machine learning family, the output describes the fitted window, never the future.
Gaussian Mixture Models Settings
- Components (default 2): 3 adds a middle transition tier.
- Features (default Returns + Volatility): the observation vector.
- Return Source (default close): feeds the log returns.
- Volatility Measure (default Stdev of Returns) with Volatility Length (default 14): the volatility feature and its lookback; or ATR %.
- Training Window (default 200): rolling observations per fit.
- Max EM Steps per Bar (default 10): update cap per bar.
- Update Mode (default Incremental (Warm Start)): or a full refit each bar.
- Probability Smoothing (default 3): EMA on the probabilities.
- Anomaly Percentile (default 5): likelihood cutoff for anomaly flags.
- Fit on Closed Bars (default enabled): confirmed bars only.
- Dashboard & style: placement, gradient, bar coloring, anomaly markers.
Frequently Asked Questions

The Library is free. Quant makes it yours.
Pull any concept or indicator into Quant: rebuild it, retune it, or turn it into a backtested strategy of your own.