Hidden Markov Model Market Regimes
![]() By LuxAlgoFeb 11, 2026
By LuxAlgoFeb 11, 2026
The Hidden Markov Model Market Regimes [LuxAlgo] is a professional-grade trading indicator that applies a probabilistic Hidden Markov Model (HMM) framework to price action and volatility data in order to classify the market into distinct regimes. Instead of relying on traditional trend indicators alone, this tool estimates the probability of different market states in real time, helping traders adapt their trading strategy to changing volatility and structural conditions.
By transforming raw returns and volatility into regime probabilities (0–100%), this trading indicator allows users to identify whether the market is trending calmly, chopping aggressively, crashing, or quietly accumulating—making it ideal for systematic traders, discretionary traders, and portfolio managers seeking dynamic risk allocation.
How to Trade the Hidden Markov Model Market Regimes Indicator?
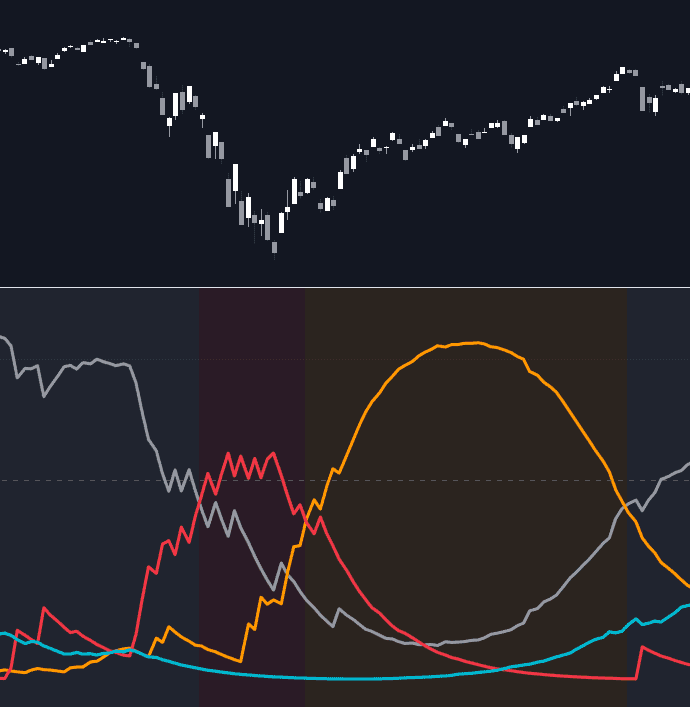
The Hidden Markov Model Market Regimes indicator identifies four distinct market regimes. Each regime is displayed with a unique color, and its corresponding oscillator line represents the probability that the market is currently in that state.
Rather than giving a simple “bullish” or “bearish” signal, this trading indicator answers a deeper question:
What structural environment is the market operating in right now?
Understanding regime context allows traders to switch between trend-following, mean-reversion, hedging, or capital-preservation strategies more effectively.
Regime Breakdown & Trading Implications
-
Low Volatility Trend (Gray):
Characterized by steady, consistent directional returns with limited volatility expansion. This environment favors trend-following strategies, breakout systems, moving average strategies, and longer holding periods. Position sizing can typically be more stable due to reduced volatility shocks. -
High Volatility Chop (Orange):
Defined by large price swings without clear directional bias. This regime often frustrates breakout traders and favors mean-reversion systems, short-term scalping, or reduced exposure. Risk management becomes critical in this environment. -
Crash Regime (Red):
Marked by extreme negative returns combined with volatility spikes. This state signals panic-driven price action and structural instability. Traders may consider defensive positioning, hedging strategies, volatility-based trading systems, or capital preservation techniques. -
Accumulation (Blue):
Identified by low volatility and neutral-to-rounding price behavior. This regime often appears near market bottoms or consolidation bases before trend expansion. Swing traders may monitor this phase for early breakout positioning.
By monitoring probability shifts between these regimes, traders can dynamically adjust their trading strategy rather than applying a static system across all conditions.
Visual Cues & Probability Signals
The indicator features dynamic background highlighting based on the Dominant State—the regime with the highest probability at the current bar.
Key probabilistic thresholds:
- Above 50%: The model is showing directional conviction toward that regime.
- Above 80%: High-confidence regime classification.
- Probability Flips: When one regime’s probability rapidly overtakes another, this often signals a structural market transition.
These “probability flips” are particularly useful for systematic traders who want objective regime-switching logic in algorithmic trading models.
Detailed Explanation of the Hidden Markov Model Logic
This trading indicator implements a specialized version of the Forward Algorithm to estimate the likelihood of hidden states using price-derived features. While the term “Hidden Markov Model” is commonly associated with machine learning, this implementation is deterministic and transparent.
Heuristic vs. Trained Machine Learning Model
It is important to understand that this is a Heuristic (Static) HMM, not a fully trained machine learning model.
Unlike traditional ML-based HMMs trained with:
- Baum-Welch Algorithm
- Expectation-Maximization
This version uses predefined parameters and emission structures. The benefits of this approach include:
- Deterministic outputs (same inputs = same results)
- No need for external training datasets
- No black-box retraining risks
- Full transparency in how probabilities are calculated
This makes it highly suitable for trading strategies that require consistency and backtesting reliability.
Mathematical Logic Behind the Model
The model uses three core components:
-
Log Returns:
The indicator calculates log returns instead of simple percentage returns to ensure time additivity and improved statistical symmetry. Log returns provide a more mathematically stable foundation for regime classification. -
Emission Likelihoods:
Each regime has a Gaussian-style emission profile. The model compares normalized returns and volatility against these predefined profiles.
For example:- Crash Regime likelihood increases when returns are significantly negative and volatility is elevated.
- Low Volatility Trend likelihood increases when returns are steady and volatility is suppressed.
-
Transition Matrix (Markov Property):
The transition matrix defines how likely the market is to remain in its current state versus switching regimes. Diagonal dominance ensures persistence, meaning the model statistically favors regime continuity rather than erratic state switching.
This probabilistic structure provides regime smoothing while still reacting to structural breaks.
Settings & Customization
HMM Settings
-
Lookback Period:
Determines the window used to calculate mean and standard deviation for return and volatility normalization. Shorter lookbacks increase responsiveness; longer lookbacks increase stability. -
Learning Rate:
Controls how quickly the model updates internal state probabilities.- 0.01 → Very stable, slow-changing regime probabilities
- 1.0 → Highly reactive, near-instant regime shifts
Traders can adjust this depending on whether they prefer early detection or regime stability.
Dashboard Settings
-
Enable Dashboard:
Displays an on-screen probability table summarizing current regime metrics. -
Position:
Choose between Top Right, Bottom Right, or Bottom Left placement. -
Size:
Adjust the scaling of text and dashboard elements for better chart visibility.
Why Use a Market Regime Trading Indicator?
Most trading indicators assume a static environment. However, financial markets cycle between expansion, contraction, panic, and consolidation phases.
The Hidden Markov Model Market Regimes indicator provides:
- Adaptive trading strategy alignment
- Objective regime classification
- Probabilistic confidence metrics
- Improved risk management logic
- Structural shift detection
For algorithmic traders, the regime probabilities can be integrated directly into position sizing rules, strategy toggling, or risk overlays. For discretionary traders, it provides contextual awareness that prevents applying the wrong strategy to the wrong market condition.
Frequently Asked Questions
What is a Hidden Markov Model in trading?
A Hidden Markov Model (HMM) is a probabilistic framework that assumes markets transition between hidden states (regimes). While these states cannot be directly observed, they can be inferred using observable data such as price returns and volatility.
Is this indicator a machine learning model?
No. This is a heuristic-based HMM with fixed parameters. It does not require external training or dataset fitting, ensuring deterministic and consistent behavior for backtesting and live trading.
How can this indicator improve my trading strategy?
By identifying whether the market is trending, chopping, crashing, or accumulating, you can dynamically adjust your strategy selection, risk exposure, and trade frequency.
How do I access the Hidden Markov Model Market Regimes [LuxAlgo]?
You can get access on the LuxAlgo Library for charting platforms like TradingView, MetaTrader (MT4/MT5), and NinjaTrader for free.
Free indicator
Get free access to this indicator on the platforms below.
Unlock the entire LuxAlgo Library
Every indicator, every strategy, full charts, and complete access to Quant — our AI agent.