Concept
Hurst Exponent
Hurst Exponent, also known as R/S analysis, DFA, is a Statistics concept. The Library holds 1 implementation, a working definition you can pull into Quant.
Top Hurst Exponent indicator
The top custom implementation, built on the original standard Hurst Exponent formula.
1 total
Want to trade Hurst Exponent? The implementation below is one prompt away from a backtested strategy in Quant.
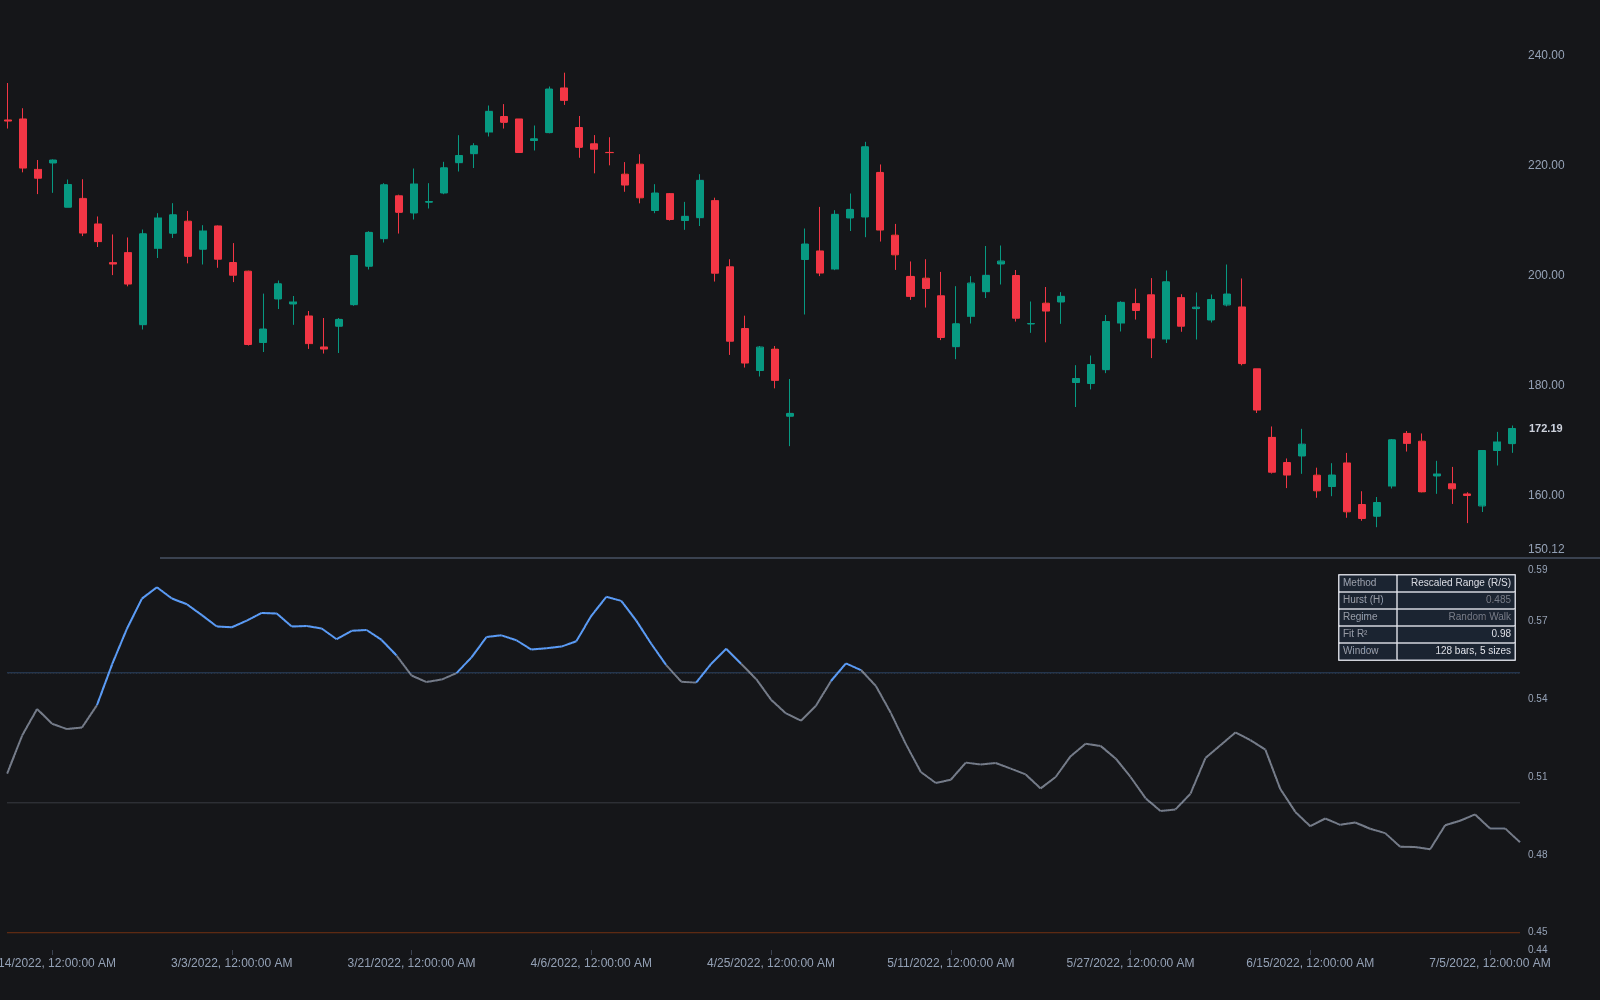
What is the Hurst Exponent?
The Hurst exponent (H) measures long-range dependence in a series: whether moves tend to continue, partially reverse, or wander at random. H near 0.5 is consistent with a random walk, where past increments say nothing about the next. H above 0.5 indicates persistence, a trending character; H below 0.5 indicates anti-persistence, a mean-reverting character. It is named for Harold Edwin Hurst, who developed the method studying Nile river flows; Mandelbrot later brought it into finance as part of fractal market analysis, where it mirrors fractal dimension (D equals 2 minus H for self-affine series).
The classical estimator is rescaled-range (R/S) analysis: for each window size, divide the range of cumulative deviations from the mean by the standard deviation, then fit the slope of log R/S against log window size; that slope is H. Detrended fluctuation analysis (DFA) is a common alternative that removes local trends before measuring. Both need substantial data, and estimates on trading-sized windows carry wide error bands, so rolling readings are tendencies, not precise numbers.
The estimators repay understanding. R/S accumulates deviations from the mean and asks how the accumulated range grows with window size: persistent series wander farther than chance, anti-persistent ones keep pulling themselves back, and the growth exponent is H. Its known flaw is upward bias on short samples, where even random data reads persistent. DFA fits and removes a local trend inside each segment before measuring fluctuations, buying robustness against the drifts and regime shifts that contaminate R/S on real markets. Both want hundreds to thousands of observations, and both can legitimately disagree on the same window, which is why H should always be quoted with its estimator.
One more honesty layer: H is horizon-dependent. Real markets are not cleanly self-affine, so the exponent measured on five-minute bars need not match the daily one, and an instrument can trend on one clock while reverting on another, information in itself for choosing which timeframe a strategy should live on. Applied work reflects this: dimension-and-persistence oscillators modulate momentum tools by rolling H, pairs traders screen spreads for anti-persistence before fitting reversion models, and regime dashboards read H beside autocorrelation and efficiency gauges, trusting the call where independent measures agree and ranking readings against their own percentile history rather than fixed thresholds.
How to identify Hurst exponent readings
Estimate on generous data, smooth, and read against 0.5 with wide error bars in mind.
- 1Gather enough history: hundreds of observations minimum, since scaling exponents estimated on small windows are mostly noise.
- 2Choose the estimator and disclose it: R/S for the classical read, DFA where trends and regime shifts would contaminate it.
- 3Compute the log-log slope: fluctuation measure against window size across several scales; the slope is H.
- 4Smooth rolling readings before consuming them, because raw windowed estimates jump bar to bar.
- 5Read zones, not points: persistently above 0.5 supports trend logic, persistently below supports reversion, and readings hugging 0.5 argue for standing both down.
How traders use it
- As a regime filter: readings persistently above 0.5 support trend-following logic, readings below favor fading and mean reversion, and readings hugging 0.5 argue for standing down both (see Market Efficiency & Regime Persistence Measures for simpler relatives).
- As a rolling persistence gauge: a smoothed H series scales exposure or switches playbooks as the market's character shifts, with smoothing applied because raw estimates jump.
- As a strategy-fit check: estimating H on the instrument and timeframe actually traded tests whether momentum or mean-reversion logic has statistical footing there before any backtest is run.
- For spread selection: pairs and relative-value traders screen candidate spreads for anti-persistence, low H on the spread being the statistical footprint of the reversion the strategy needs.
- Across horizons: profiling H per timeframe maps which clocks an instrument trends on and which it reverts on, guiding both strategy assignment and the timeframe a given playbook should execute on.
Hurst exponent vs related memory measures
Fractal Dimension: Mathematically mirrored for self-affine series, dimension equals two minus H, but framed and estimated differently: dimension reads geometric roughness in a window, Hurst reads long-range persistence across scales. Finite data lets the two disagree, which is worth knowing before treating either as truth.
Autocorrelation: Autocorrelation measures memory lag by lag, local and fast; Hurst compresses memory across all scales into one exponent, global and slow. The ACF answers whether yesterday predicts today; H answers whether the series' whole character leans persistent or contrarian.
Entropy Measures: Entropy quantifies disorder in the distribution of moves without caring about their arrangement in time; Hurst is precisely about the arrangement. A series can be high-entropy yet persistent, or orderly yet memoryless, which is why regime dashboards run both.
Concept family
Statistics
46 concepts mapped · 46 in the Library
Hurst Exponent FAQ
Turn Hurst Exponent into a trading strategy.
Take the implementation from this page into Quant, then build on it, backtest it on real data, and keep refining it in conversation.