


ICT Anchored Market Structures with Validation
 by LuxAlgo · Oct 15, 2025
The ICT Anchored Market Structures with Validation trading indicator is an advanced evolution of LuxAlgo’s popular Pure Price Action Structures tool — designed to bring precision, objectivity, and automation to price action analysis. It helps traders visualize real-time market structure shifts, trend confirmations, and liquidity sweeps across short, intermediate, and long-term market phases — all anchored directly to price, without relying on any external or user-defined inputs. This makes it one of the most objective price action trading indicators available for traders who follow ICT concepts or structure-based strategies.
The indicator automatically identifies structural highs and lows, validates CHoCH (Change of Character) and BoS (Break of Structure) signals, and visually distinguishes between confirmed trend shifts and false sweeps — enabling traders to filter noise, anticipate reversals, and trade with confidence.
How to Trade the ICT Anchored Market Structures with Validation Indicator
Market structure is one of the most critical foundations of price action trading strategies. This indicator automatically detects and displays real-time structures across multiple time horizons — short, intermediate, and long-term — allowing traders to instantly identify the market’s directional bias.
By observing these automated structure levels, traders can easily see when a market is transitioning from accumulation to expansion, shifting between bullish and bearish conditions, or simply consolidating.
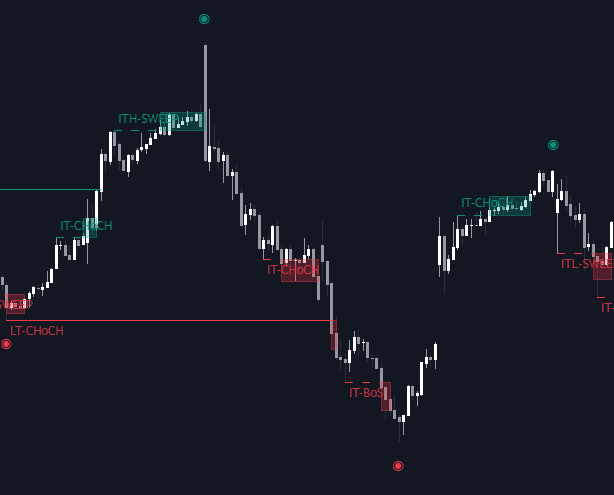
When a Change of Character (CHoCH) occurs, it signals a potential reversal — often appearing when price breaches a previous swing high or low. In contrast, a Break of Structure (BoS) confirms continuation in the prevailing trend direction. Understanding these dynamics helps traders determine when to enter or stay in a trade, aligning entries with the broader trend or counter-trend reversals.
It’s essential to recognize that not every CHoCH or BoS guarantees a reversal or continuation. Sometimes, these areas simply act as liquidity zones — where price seeks orders before resuming its primary direction. That’s where this indicator’s validation logic comes in, confirming whether a structure represents a true breakout or a liquidity sweep, adding another layer of accuracy to your market structure trading strategy.
Understanding Market Structure Logic
What Are Market Structures?
Market structures are built from the natural swing highs and lows created by price action. This concept lies at the heart of ICT trading methodologies and many advanced price action trading strategies.
The indicator identifies swing points automatically, purely based on price — ensuring no user bias influences the detection. These swing points are the foundation upon which the market structure framework is built.
How Swing Points Are Used in Trading
Swing points are crucial for understanding market trends and identifying key trading opportunities. While short-term swing points may appear with minimal delay, intermediate and long-term swings depend on later price action to form — meaning they’re more reliable for structure-based analysis rather than real-time signals.
Traders use historical swing points to:
- Recognize Trends: Higher swing highs/lows indicate an uptrend, while lower swing highs/lows indicate a downtrend.
- Identify Key Liquidity Levels: Swing highs represent Buyside Liquidity Zones, while swing lows mark Sellside Liquidity Zones — both are critical for identifying potential reaction points.
- Spot Reversal Patterns: Swing formations often build classical reversal setups like double tops/bottoms or head-and-shoulders patterns.
- Plan Risk Management: Swings are ideal for setting stop loss and take profit levels — as these areas often contain liquidity pools targeted by institutional moves.
These elements form the backbone of smart money concepts (SMC) and ICT-based trading strategies, helping traders understand how price flows and where liquidity resides.
Market Structure Validation Logic
Validation ensures that each detected CHoCH or BoS is more than just a temporary wick or fake-out. The indicator checks whether the price closes beyond the deviation range defined by a 17-period ATR (Average True Range).
- Confirmed Breakout: The close is beyond the ATR deviation zone.
- Sweep: The price breaches but closes within the deviation range, marking a liquidity grab.
When a sweep is detected, the indicator labels it clearly and draws a visual box highlighting the price range of the event. This feature helps traders instantly recognize liquidity sweeps versus genuine breakouts — a key distinction in professional-level ICT trading systems.
Customization & Settings
The indicator’s flexibility allows traders to personalize how structures appear on their charts for improved visibility and workflow efficiency.
Structure Settings
- Swings & Size: Show or hide swing highs/lows, customize icons, and adjust their size.
- Market Structure Lines: Toggle structure lines for trend visualization.
- Validation Display: Enable or disable breakout validation logic.
- Structure Labels: Show CHoCH/BoS labels directly on chart.
- Line Style & Width: Modify visual presentation to suit your chart theme.
- Colors & Themes: Adjust swing and label colors for easier structure distinction.
These options make the ICT Anchored Market Structures indicator suitable for traders across all styles — from scalpers to swing traders — who rely on clean, informative structure visualization.
Related LuxAlgo Indicators
FAQ
What makes the ICT Anchored Market Structures with Validation indicator unique?
It’s entirely based on pure price action — no user inputs or lagging filters — ensuring objective and repeatable structure detection.
How can I use this indicator with my trading strategy?
You can combine CHoCH and BoS signals with supply-demand zones, fair value gaps, or liquidity concepts to build a comprehensive ICT-based trading approach.
Does the indicator repaint?
Short-term swing points may adjust slightly as new candles form, but validated structures remain fixed once confirmed, ensuring accurate historical visualization.
How can I access the ICT Anchored Market Structures with Validation indicator?
You can get access to the ICT Anchored Market Structures with Validation trading indicator directly from the LuxAlgo Library, available for popular charting platforms like TradingView, MetaTrader (MT4/MT5), and NinjaTrader, completely free.
Unlock Unlimited Access to the LuxAlgo Library
Upgrade your plan to get all indicators, strategies, charts, and full access to Quant, our AI agent.
Trading & investing are risky and many will lose money in connection with trading and investing activities. All content on this site is not intended to, and should not be, construed as financial advice. Decisions to buy, sell, hold or trade in securities, commodities and other investments involve risk and are best made based on the advice of qualified financial professionals. Past performance does not guarantee future results.
Hypothetical or Simulated performance results have certain limitations. Unlike an actual performance record, simulated results do not represent actual trading. Also, since the trades have not been executed, the results may have under-or-over compensated for the impact, if any, of certain market factors, including, but not limited to, lack of liquidity. Simulated trading programs in general are designed with the benefit of hindsight, and are based on historical information. No representation is being made that any account will or is likely to achieve profit or losses similar to those shown.
Testimonials appearing on this website may not be representative of other clients or customers and is not a guarantee of future performance or success.
As a provider of technical analysis tools and strategies, we do not have access to the personal trading accounts or brokerage statements of our customers. As a result, we have no reason to believe our customers perform better or worse than traders as a whole based on any content, tool, or platform feature we provide.
Charts used on this site are by TradingView in which the majority of our technical indicators are built on. TradingView® is a registered trademark of TradingView, Inc. www.TradingView.com TradingView® has no affiliation with the owner, developer, or provider of the Services described herein.
Market data is provided by CBOE, CME Group, BarChart, Massive, CoinAPI. Select U.S. equities data is provided through Massive. CBOE BZX real-time U.S. equities data is licensed from CBOE and provided through BarChart. Real-time futures data is licensed from CME Group and provided through BarChart. Select cryptocurrency data, including major coins, is provided through CoinAPI. All data is provided “as is” and should be verified independently for trading purposes.
This does not represent our full Disclaimer. Please read our full disclaimer.
© 2026 LuxAlgo Global, LLC.