Implied Volatility
 By LuxAlgoJun 12, 2026
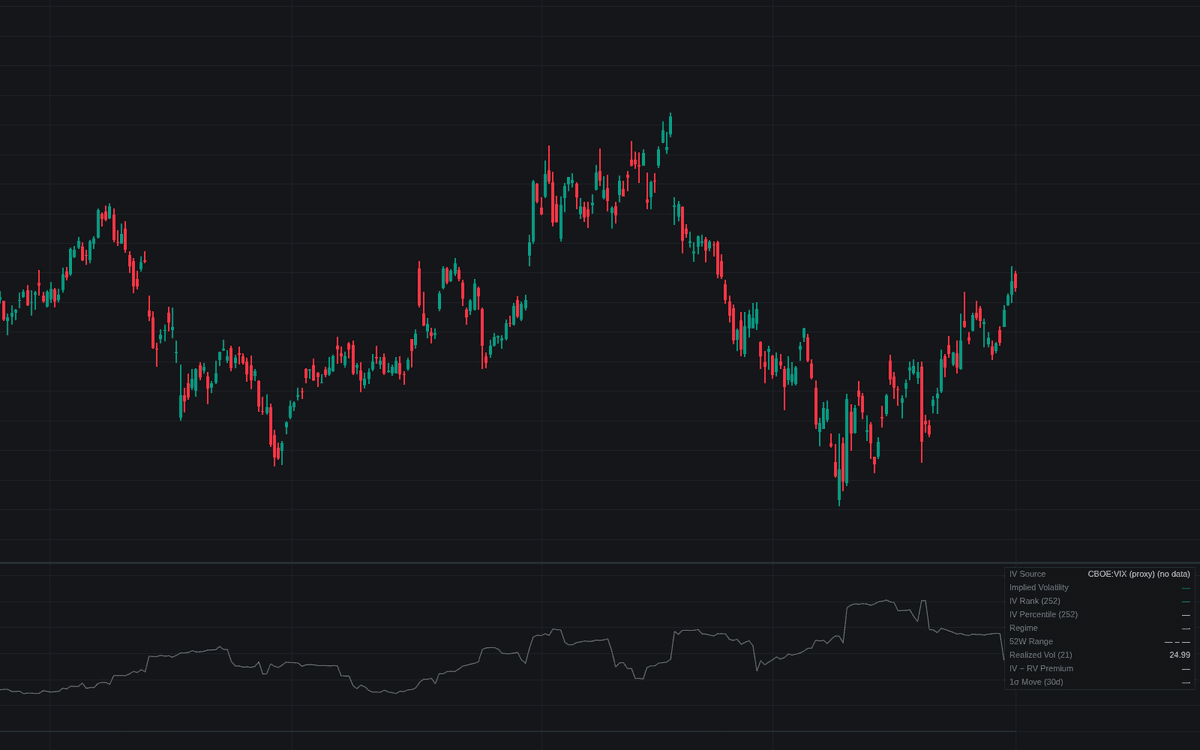

Implied Volatility auto-detects the published implied volatility index matching the chart symbol (VIX for the S&P 500, VXN for the Nasdaq 100, GVZ for gold, OVX for crude, EVZ for EUR/USD, BVIV/EVIV for crypto) and plots it with IV Rank and IV Percentile over a 252-session lookback. Regime bands frame the print inside its 52-week range, and a realized-volatility overlay exposes the volatility risk premium.
How to Trade the Implied Volatility?
- High regime (IV Rank at or above 50): premium rich versus its own year. Expect wider movement when sizing and placing stops.
- Low regime (IV Rank at or below 20): premium cheap versus the past year, compressed expectations that often precede expansion.
- IV crossing above realized volatility: the market paying for more movement than delivered; the IV − RV row tracks the spread.
- 1σ expected move: the dashboard converts IV into a ±price range, the direct input to stop distance and position size.
The rest of the volatility family measures what price did; this pane shows what options are paying for next.
Implied Volatility Settings
- IV Source (default Auto): auto-detect the symbol's IV index or read the manual symbol.
- Manual IV Symbol and Auto Fallback Index (defaults CBOE:VIX): the Manual series and the proxy Auto falls back to.
- IV Timeframe (default D): where the IV series is sampled.
- Lookback (Sessions) (default 252): the IV Rank and IV Percentile window, the 52-week convention.
- Rank High ≥ / Low ≤ (defaults 50 / 20) and Percentile High ≥ / Low ≤ (defaults 80 / 20): the regime thresholds.
- Realized Volatility Length (default 21): close-to-close window, annualized to the IV scale.
- Expected Move Horizon (Days) (default 30): calendar days behind the 1σ move.
- Dashboard, band display, and colors are style options.
Frequently Asked Questions

Original indicatorBuilt in-house by LuxAlgo
The Library is free. Quant makes it yours.
Pull any concept or indicator into Quant: rebuild it, retune it, or turn it into a backtested strategy of your own.